Data
87,996 items of data are available, covering 83,313 participants.
Defined-instances run from 2 to 3, labelled using Instancing
2.
Units of measurement are mm.
| Maximum | 3.878 |
| Decile 9 | 3.344 |
| Decile 8 | 3.272 |
| Decile 7 | 3.218 |
| Decile 6 | 3.171 |
| Median | 3.128 |
| Decile 4 | 3.083 |
| Decile 3 | 3.032 |
| Decile 2 | 2.972 |
| Decile 1 | 2.881 |
| Minimum | 1.321 |
|

|
- Mean = 3.11857
- Std.dev = 0.186041
- 122 items below graph minimum of 2.418
- 4 items above graph maximum of 3.807
|
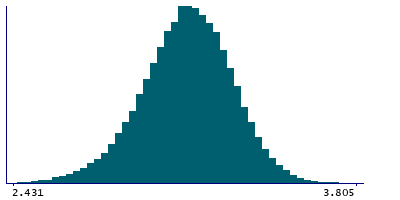
2 Instances
Instance 2 : Imaging visit (2014+)
83,241 participants, 83,241 items
| Maximum | 3.878 |
| Decile 9 | 3.344 |
| Decile 8 | 3.272 |
| Decile 7 | 3.218 |
| Decile 6 | 3.171 |
| Median | 3.126 |
| Decile 4 | 3.082 |
| Decile 3 | 3.031 |
| Decile 2 | 2.97 |
| Decile 1 | 2.879 |
| Minimum | 1.321 |
|
|
- Mean = 3.11745
- Std.dev = 0.186635
- 116 items below graph minimum of 2.414
- 3 items above graph maximum of 3.809
|
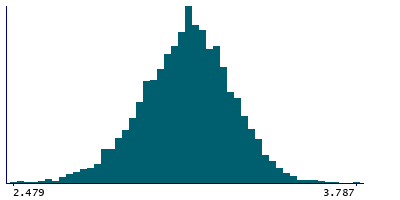
Instance 3 : First repeat imaging visit (2019+)
4,755 participants, 4,755 items
| Maximum | 3.81 |
| Decile 9 | 3.351 |
| Decile 8 | 3.279 |
| Decile 7 | 3.232 |
| Decile 6 | 3.186 |
| Median | 3.146 |
| Decile 4 | 3.105 |
| Decile 3 | 3.056 |
| Decile 2 | 2.996 |
| Decile 1 | 2.915 |
| Minimum | 2.331 |
|
|
- Mean = 3.13816
- Std.dev = 0.174161
- 4 items below graph minimum of 2.479
- 2 items above graph maximum of 3.787
|
Notes
Mean thickness of G-cingul-Post-dorsal in the left hemisphere generated by parcellation of the white surface using Destrieux (a2009s) parcellation
0 Related Data-Fields
There are no related data-fields
0 Resources
There are no matching Resources
