Data
87,996 items of data are available, covering 83,313 participants.
Defined-instances run from 2 to 3, labelled using Instancing
2.
Units of measurement are mm.
| Maximum | 3.893 |
| Decile 9 | 2.925 |
| Decile 8 | 2.813 |
| Decile 7 | 2.731 |
| Decile 6 | 2.661 |
| Median | 2.595 |
| Decile 4 | 2.528 |
| Decile 3 | 2.456 |
| Decile 2 | 2.37 |
| Decile 1 | 2.25 |
| Minimum | 0.835 |
|

|
- Mean = 2.59031
- Std.dev = 0.264757
- 19 items below graph minimum of 1.575
- 6 items above graph maximum of 3.6
|
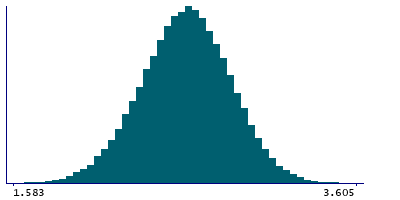
2 Instances
Instance 2 : Imaging visit (2014+)
83,241 participants, 83,241 items
| Maximum | 3.893 |
| Decile 9 | 2.926 |
| Decile 8 | 2.813 |
| Decile 7 | 2.731 |
| Decile 6 | 2.661 |
| Median | 2.595 |
| Decile 4 | 2.528 |
| Decile 3 | 2.455 |
| Decile 2 | 2.369 |
| Decile 1 | 2.249 |
| Minimum | 0.835 |
|
|
- Mean = 2.5902
- Std.dev = 0.265112
- 17 items below graph minimum of 1.572
- 6 items above graph maximum of 3.603
|
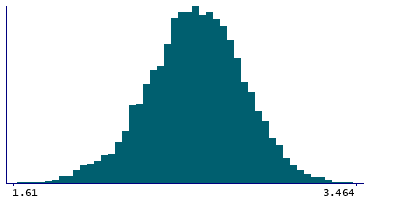
Instance 3 : First repeat imaging visit (2019+)
4,755 participants, 4,755 items
| Maximum | 3.464 |
| Decile 9 | 2.914 |
| Decile 8 | 2.808 |
| Decile 7 | 2.7315 |
| Decile 6 | 2.666 |
| Median | 2.597 |
| Decile 4 | 2.533 |
| Decile 3 | 2.467 |
| Decile 2 | 2.381 |
| Decile 1 | 2.262 |
| Minimum | 1.371 |
|
|
- Mean = 2.59221
- Std.dev = 0.258456
- 2 items below graph minimum of 1.61
- 1 item above graph maximum of 3.464
|
Notes
Mean thickness of G-cingul-Post-ventral in the left hemisphere generated by parcellation of the white surface using Destrieux (a2009s) parcellation
0 Related Data-Fields
There are no related data-fields
0 Resources
There are no matching Resources
