Data
87,996 items of data are available, covering 83,313 participants.
Defined-instances run from 2 to 3, labelled using Instancing
2.
Units of measurement are mm.
| Maximum | 2.76 |
| Decile 9 | 2.175 |
| Decile 8 | 2.101 |
| Decile 7 | 2.048 |
| Decile 6 | 2.002 |
| Median | 1.959 |
| Decile 4 | 1.914 |
| Decile 3 | 1.867 |
| Decile 2 | 1.809 |
| Decile 1 | 1.726 |
| Minimum | 1.133 |
|
|
- Mean = 1.95398
- Std.dev = 0.175074
- 8 items below graph minimum of 1.277
- 4 items above graph maximum of 2.624
|
2 Instances
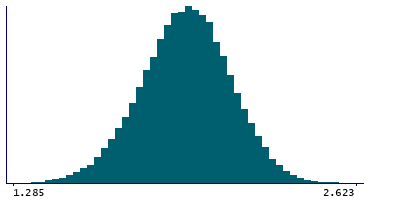
Instance 2 : Imaging visit (2014+)
83,241 participants, 83,241 items
| Maximum | 2.76 |
| Decile 9 | 2.174 |
| Decile 8 | 2.1 |
| Decile 7 | 2.047 |
| Decile 6 | 2.001 |
| Median | 1.958 |
| Decile 4 | 1.914 |
| Decile 3 | 1.866 |
| Decile 2 | 1.809 |
| Decile 1 | 1.726 |
| Minimum | 1.133 |
|

|
- Mean = 1.9531
- Std.dev = 0.174974
- 8 items below graph minimum of 1.278
- 3 items above graph maximum of 2.622
|
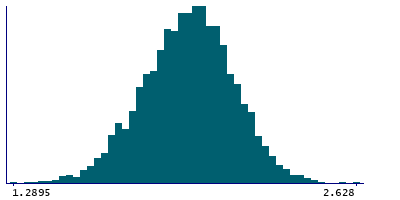
Instance 3 : First repeat imaging visit (2019+)
4,755 participants, 4,755 items
| Maximum | 2.628 |
| Decile 9 | 2.1905 |
| Decile 8 | 2.115 |
| Decile 7 | 2.066 |
| Decile 6 | 2.019 |
| Median | 1.977 |
| Decile 4 | 1.932 |
| Decile 3 | 1.882 |
| Decile 2 | 1.822 |
| Decile 1 | 1.74 |
| Minimum | 1.285 |
|
|
- Mean = 1.96945
- Std.dev = 0.176102
- 1 item below graph minimum of 1.2895
|
Notes
Mean thickness of G-oc-temp-med-Lingual in the left hemisphere generated by parcellation of the white surface using Destrieux (a2009s) parcellation
0 Related Data-Fields
There are no related data-fields
0 Resources
There are no matching Resources
