Data
87,996 items of data are available, covering 83,313 participants.
Defined-instances run from 2 to 3, labelled using Instancing
2.
Units of measurement are mm.
| Maximum | 4.01 |
| Decile 9 | 3.138 |
| Decile 8 | 3.019 |
| Decile 7 | 2.941 |
| Decile 6 | 2.879 |
| Median | 2.823 |
| Decile 4 | 2.769 |
| Decile 3 | 2.71 |
| Decile 2 | 2.638 |
| Decile 1 | 2.526 |
| Minimum | 0.875 |
|

|
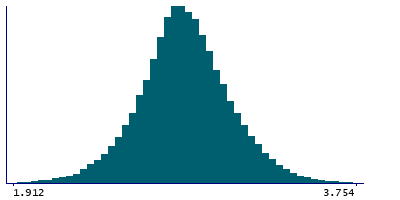
- Mean = 2.82635
- Std.dev = 0.246876
- 82 items below graph minimum of 1.914
- 28 items above graph maximum of 3.75
|
2 Instances
Instance 2 : Imaging visit (2014+)
83,241 participants, 83,241 items
| Maximum | 4.01 |
| Decile 9 | 3.138 |
| Decile 8 | 3.02 |
| Decile 7 | 2.941 |
| Decile 6 | 2.879 |
| Median | 2.823 |
| Decile 4 | 2.769 |
| Decile 3 | 2.711 |
| Decile 2 | 2.638 |
| Decile 1 | 2.526 |
| Minimum | 0.875 |
|
|
- Mean = 2.82656
- Std.dev = 0.246915
- 75 items below graph minimum of 1.914
- 27 items above graph maximum of 3.75
|
Instance 3 : First repeat imaging visit (2019+)
4,755 participants, 4,755 items
| Maximum | 3.759 |
| Decile 9 | 3.1325 |
| Decile 8 | 3.008 |
| Decile 7 | 2.936 |
| Decile 6 | 2.874 |
| Median | 2.818 |
| Decile 4 | 2.764 |
| Decile 3 | 2.707 |
| Decile 2 | 2.639 |
| Decile 1 | 2.531 |
| Minimum | 0.898 |
|

|
- Mean = 2.82264
- Std.dev = 0.246171
- 8 items below graph minimum of 1.9295
- 2 items above graph maximum of 3.734
|
Notes
Mean thickness of S-collat-transv-ant in the left hemisphere generated by parcellation of the white surface using Destrieux (a2009s) parcellation
0 Related Data-Fields
There are no related data-fields
0 Resources
There are no matching Resources
