Data
87,996 items of data are available, covering 83,313 participants.
Defined-instances run from 2 to 3, labelled using Instancing
2.
Units of measurement are mm.
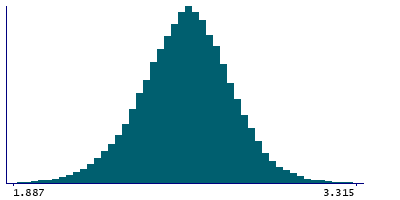
| Maximum | 3.595 |
| Decile 9 | 2.836 |
| Decile 8 | 2.756 |
| Decile 7 | 2.699 |
| Decile 6 | 2.651 |
| Median | 2.607 |
| Decile 4 | 2.561 |
| Decile 3 | 2.511 |
| Decile 2 | 2.45 |
| Decile 1 | 2.362 |
| Minimum | 1.381 |
|

|
- Mean = 2.60203
- Std.dev = 0.190605
- 61 items below graph minimum of 1.888
- 40 items above graph maximum of 3.31
|
2 Instances
Instance 2 : Imaging visit (2014+)
83,241 participants, 83,241 items
| Maximum | 3.595 |
| Decile 9 | 2.837 |
| Decile 8 | 2.756 |
| Decile 7 | 2.699 |
| Decile 6 | 2.651 |
| Median | 2.607 |
| Decile 4 | 2.561 |
| Decile 3 | 2.511 |
| Decile 2 | 2.45 |
| Decile 1 | 2.361 |
| Minimum | 1.396 |
|
|
- Mean = 2.60206
- Std.dev = 0.190631
- 56 items below graph minimum of 1.885
- 37 items above graph maximum of 3.313
|
Instance 3 : First repeat imaging visit (2019+)
4,755 participants, 4,755 items
| Maximum | 3.359 |
| Decile 9 | 2.8315 |
| Decile 8 | 2.75 |
| Decile 7 | 2.698 |
| Decile 6 | 2.651 |
| Median | 2.608 |
| Decile 4 | 2.561 |
| Decile 3 | 2.511 |
| Decile 2 | 2.454 |
| Decile 1 | 2.368 |
| Minimum | 1.381 |
|

|
- Mean = 2.6016
- Std.dev = 0.190144
- 6 items below graph minimum of 1.9045
- 2 items above graph maximum of 3.295
|
Notes
Mean thickness of S-temporal-inf in the left hemisphere generated by parcellation of the white surface using Destrieux (a2009s) parcellation
0 Related Data-Fields
There are no related data-fields
0 Resources
There are no matching Resources
