Data
87,996 items of data are available, covering 83,313 participants.
Defined-instances run from 2 to 3, labelled using Instancing
2.
Units of measurement are mm.
| Maximum | 3.931 |
| Decile 9 | 2.989 |
| Decile 8 | 2.88 |
| Decile 7 | 2.801 |
| Decile 6 | 2.733 |
| Median | 2.669 |
| Decile 4 | 2.606 |
| Decile 3 | 2.537 |
| Decile 2 | 2.457 |
| Decile 1 | 2.344 |
| Minimum | 0 |
|

|
- Mean = 2.66739
- Std.dev = 0.252723
- 24 items below graph minimum of 1.699
- 4 items above graph maximum of 3.634
|
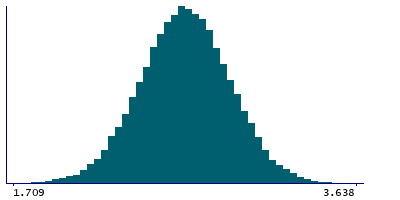
2 Instances
Instance 2 : Imaging visit (2014+)
83,241 participants, 83,241 items
| Maximum | 3.931 |
| Decile 9 | 2.989 |
| Decile 8 | 2.879 |
| Decile 7 | 2.8 |
| Decile 6 | 2.733 |
| Median | 2.669 |
| Decile 4 | 2.605 |
| Decile 3 | 2.537 |
| Decile 2 | 2.457 |
| Decile 1 | 2.344 |
| Minimum | 1.175 |
|
|
- Mean = 2.66708
- Std.dev = 0.252683
- 21 items below graph minimum of 1.699
- 4 items above graph maximum of 3.634
|
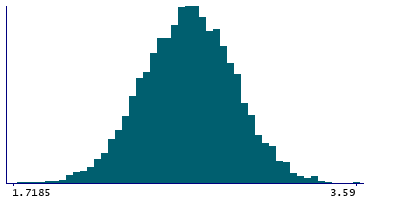
Instance 3 : First repeat imaging visit (2019+)
4,755 participants, 4,755 items
| Maximum | 3.59 |
| Decile 9 | 2.9875 |
| Decile 8 | 2.883 |
| Decile 7 | 2.808 |
| Decile 6 | 2.739 |
| Median | 2.677 |
| Decile 4 | 2.613 |
| Decile 3 | 2.5415 |
| Decile 2 | 2.462 |
| Decile 1 | 2.354 |
| Minimum | 0 |
|
|
- Mean = 2.67278
- Std.dev = 0.253357
- 3 items below graph minimum of 1.7205
|
Notes
Mean thickness of G-cingul-Post-ventral in the right hemisphere generated by parcellation of the white surface using Destrieux (a2009s) parcellation
0 Related Data-Fields
There are no related data-fields
0 Resources
There are no matching Resources
