Data
87,996 items of data are available, covering 83,313 participants.
Defined-instances run from 2 to 3, labelled using Instancing
2.
Units of measurement are mm.
| Maximum | 4.512 |
| Decile 9 | 2.996 |
| Decile 8 | 2.773 |
| Decile 7 | 2.647 |
| Decile 6 | 2.546 |
| Median | 2.451 |
| Decile 4 | 2.354 |
| Decile 3 | 2.245 |
| Decile 2 | 2.109 |
| Decile 1 | 1.916 |
| Minimum | 0.575 |
|

|
- Mean = 2.46122
- Std.dev = 0.435368
- 44 items above graph maximum of 4.076
|
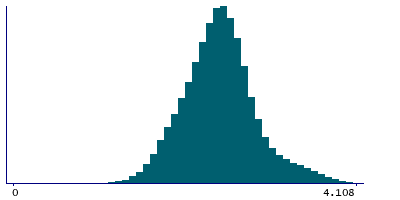
2 Instances
Instance 2 : Imaging visit (2014+)
83,241 participants, 83,241 items
| Maximum | 4.512 |
| Decile 9 | 2.995 |
| Decile 8 | 2.773 |
| Decile 7 | 2.647 |
| Decile 6 | 2.546 |
| Median | 2.451 |
| Decile 4 | 2.353 |
| Decile 3 | 2.245 |
| Decile 2 | 2.109 |
| Decile 1 | 1.916 |
| Minimum | 0.575 |
|
|
- Mean = 2.46085
- Std.dev = 0.435386
- 43 items above graph maximum of 4.074
|
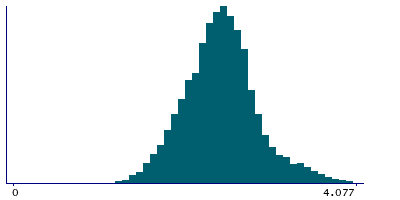
Instance 3 : First repeat imaging visit (2019+)
4,755 participants, 4,755 items
| Maximum | 4.087 |
| Decile 9 | 2.999 |
| Decile 8 | 2.778 |
| Decile 7 | 2.66 |
| Decile 6 | 2.554 |
| Median | 2.4595 |
| Decile 4 | 2.362 |
| Decile 3 | 2.254 |
| Decile 2 | 2.108 |
| Decile 1 | 1.921 |
| Minimum | 1.063 |
|
|
- Mean = 2.46772
- Std.dev = 0.435017
- 1 item above graph maximum of 4.077
|
Notes
Mean thickness of G-subcallosal in the right hemisphere generated by parcellation of the white surface using Destrieux (a2009s) parcellation
0 Related Data-Fields
There are no related data-fields
0 Resources
There are no matching Resources
