Data
82,772 items of data are available, covering 82,772 participants.
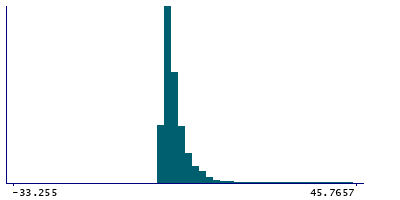
Defined-instances run from 0 to 1, labelled using Instancing
2.
| Maximum | 33098.8 |
| Decile 9 | 11.0732 |
| Decile 8 | 6.56836 |
| Decile 7 | 4.89453 |
| Decile 6 | 3.91406 |
| Median | 3.23047 |
| Decile 4 | 2.69141 |
| Decile 3 | 2.24609 |
| Decile 2 | 1.83203 |
| Decile 1 | 1.4375 |
| Minimum | -1593.7 |
|
|
- Mean = 14.8539
- Std.dev = 228.643
- 1 item below graph minimum of -33.255
- 3764 items above graph maximum of 45.7657
|
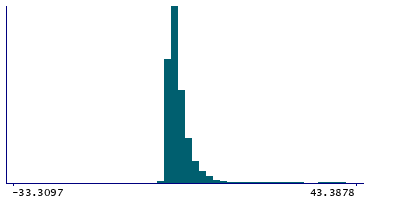
2 Instances
Instance 0 : Initial assessment visit (2006-2010) at which participants were recruited and consent given
67,222 participants, 67,222 items
| Maximum | 33098.8 |
| Decile 9 | 8.69531 |
| Decile 8 | 5.56055 |
| Decile 7 | 4.30469 |
| Decile 6 | 3.53906 |
| Median | 2.96484 |
| Decile 4 | 2.50781 |
| Decile 3 | 2.11328 |
| Decile 2 | 1.74609 |
| Decile 1 | 1.38281 |
| Minimum | -1593.7 |
|
|
- Mean = 14.0478
- Std.dev = 252.224
- 1 item below graph minimum of -33.3097
- 2725 items above graph maximum of 43.3878
|
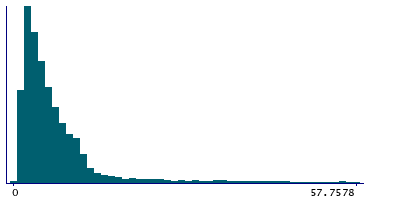
Instance 1 : First repeat assessment visit (2012-13)
15,550 participants, 15,550 items
| Maximum | 585.645 |
| Decile 9 | 29.8457 |
| Decile 8 | 11.2754 |
| Decile 7 | 8.55273 |
| Decile 6 | 6.67188 |
| Median | 5.28711 |
| Decile 4 | 4.23438 |
| Decile 3 | 3.33984 |
| Decile 2 | 2.57031 |
| Decile 1 | 1.86719 |
| Minimum | 0.646484 |
|
|
- Mean = 18.3388
- Std.dev = 56.9568
- 922 items above graph maximum of 57.8242
|
Notes
This field should be used to quality control the values generated by the Topcon Advanced Boundary Segmentation [TABS] software in
Category 100079. Information about how the research group who generated the values quality controlled them for their publication can be seen in
Return 1875.
0 Related Data-Fields
There are no related data-fields
0 Resources
There are no matching Resources
