Data
502,011 items of data are available, covering 483,401 participants.
Defined-instances run from 0 to 1, labelled using Instancing
2.
Units of measurement are millimole/L.
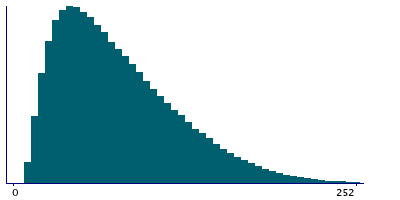
| Maximum | 380.7 |
| Decile 9 | 140 |
| Decile 8 | 113.4 |
| Decile 7 | 95.1 |
| Decile 6 | 80.7 |
| Median | 68.4 |
| Decile 4 | 57.6 |
| Decile 3 | 47.6 |
| Decile 2 | 38.1 |
| Decile 1 | 28 |
| Minimum | 10 |
|
|
- Mean = 77.3584
- Std.dev = 44.3621
- 650 items above graph maximum of 252
|
2 Instances
Instance 0 : Initial assessment visit (2006-2010) at which participants were recruited and consent given
482,734 participants, 482,734 items
| Maximum | 380.7 |
| Decile 9 | 140.2 |
| Decile 8 | 113.6 |
| Decile 7 | 95.2 |
| Decile 6 | 80.8 |
| Median | 68.5 |
| Decile 4 | 57.6 |
| Decile 3 | 47.6 |
| Decile 2 | 38.1 |
| Decile 1 | 28 |
| Minimum | 10 |
|

|
- Mean = 77.4561
- Std.dev = 44.4389
- 629 items above graph maximum of 252.4
|
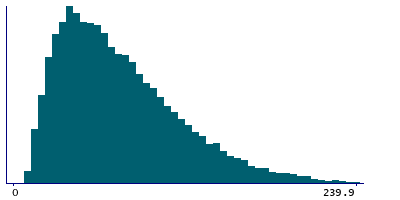
Instance 1 : First repeat assessment visit (2012-13)
19,277 participants, 19,277 items
| Maximum | 334.9 |
| Decile 9 | 134.05 |
| Decile 8 | 108.3 |
| Decile 7 | 91.1 |
| Decile 6 | 78.1 |
| Median | 66.2 |
| Decile 4 | 56.3 |
| Decile 3 | 46.7 |
| Decile 2 | 37.9 |
| Decile 1 | 28.1 |
| Minimum | 10 |
|
|
- Mean = 74.9131
- Std.dev = 42.3207
- 34 items above graph maximum of 240
|
Notes
Measured by ISE (ion selective electrode) analysis using Beckman Coulter AU5400.
3 Related Data-Fields
| Field ID | Description | Relationship |
|---|
| 30532 | Sodium in urine acquisition time | Field 30532 is the measurement time of result Current Field |
| 30533 | Sodium in urine device ID | Field 30533 indicates the device used to produce result Current Field |
| 30535 | Sodium in urine result flag | Field 30535 is the analyser flag associated with result Current Field |
1 Application
| Application ID | Title |
|---|
| 45925 | Risk Factors, Biomarkers and Impact of Major Vision-Threatening Eye Diseases |

