Data
218,579 items of data are available, covering 196,552 participants.
Defined-instances run from 0 to 3, labelled using Instancing
2.
Units of measurement are dB/MHz.
| Maximum | 209.747 |
| Decile 9 | 101.833 |
| Decile 8 | 91.9665 |
| Decile 7 | 85.607 |
| Decile 6 | 80.537 |
| Median | 75.985 |
| Decile 4 | 71.645 |
| Decile 3 | 67.158 |
| Decile 2 | 62.148 |
| Decile 1 | 55.3045 |
| Minimum | 0.328 |
|
|
- Mean = 77.9
- Std.dev = 20.5468
- 1879 items above graph maximum of 148.361
|
4 Instances
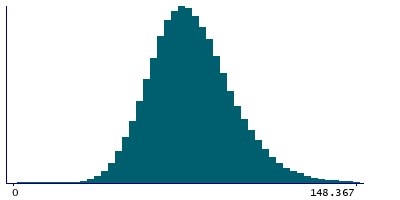
Instance 0 : Initial assessment visit (2006-2010) at which participants were recruited and consent given
164,006 participants, 164,006 items
| Maximum | 209.747 |
| Decile 9 | 101.866 |
| Decile 8 | 91.909 |
| Decile 7 | 85.5065 |
| Decile 6 | 80.429 |
| Median | 75.91 |
| Decile 4 | 71.571 |
| Decile 3 | 67.074 |
| Decile 2 | 62.0995 |
| Decile 1 | 55.341 |
| Minimum | 0.328 |
|

|
- Mean = 77.9245
- Std.dev = 20.7577
- 1566 items above graph maximum of 148.391
|
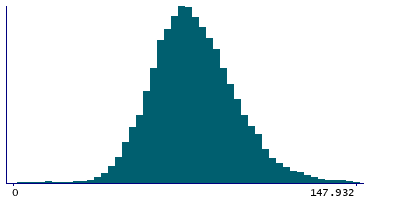
Instance 1 : First repeat assessment visit (2012-13)
19,794 participants, 19,794 items
| Maximum | 209.242 |
| Decile 9 | 102.114 |
| Decile 8 | 92.6175 |
| Decile 7 | 86.4275 |
| Decile 6 | 81.281 |
| Median | 76.766 |
| Decile 4 | 72.474 |
| Decile 3 | 68.068 |
| Decile 2 | 63.1435 |
| Decile 1 | 56.31 |
| Minimum | 2.252 |
|
|
- Mean = 78.4105
- Std.dev = 19.688
- 114 items above graph maximum of 147.918
|
Instance 2 : Imaging visit (2014+)
34,395 participants, 34,395 items
| Maximum | 209.716 |
| Decile 9 | 101.591 |
| Decile 8 | 91.8758 |
| Decile 7 | 85.6044 |
| Decile 6 | 80.6138 |
| Median | 75.9622 |
| Decile 4 | 71.5355 |
| Decile 3 | 67.0473 |
| Decile 2 | 61.8327 |
| Decile 1 | 54.6286 |
| Minimum | 2.57689 |
|

|
- Mean = 77.5139
- Std.dev = 20.0233
- 198 items above graph maximum of 148.554
|
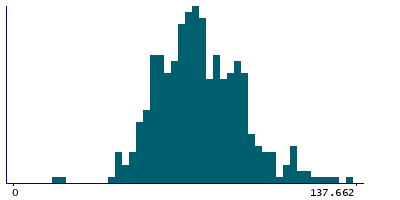
Instance 3 : First repeat imaging visit (2019+)
384 participants, 384 items
| Maximum | 182.44 |
| Decile 9 | 96.4676 |
| Decile 8 | 89.7492 |
| Decile 7 | 83.3327 |
| Decile 6 | 77.7832 |
| Median | 73.7574 |
| Decile 4 | 69.8584 |
| Decile 3 | 65.7773 |
| Decile 2 | 60.155 |
| Decile 1 | 55.2736 |
| Minimum | 16.7545 |
|
|
- Mean = 75.6963
- Std.dev = 18.8063
- 3 items above graph maximum of 137.662
|


