Data
218,925 items of data are available, covering 196,731 participants.
Defined-instances run from 0 to 3, labelled using Instancing
2.
Units of measurement are mm.
| Maximum | 71.42 |
| Decile 9 | 50.041 |
| Decile 8 | 47.854 |
| Decile 7 | 46.32 |
| Decile 6 | 45.032 |
| Median | 43.85 |
| Decile 4 | 42.686 |
| Decile 3 | 41.504 |
| Decile 2 | 40.164 |
| Decile 1 | 38.364 |
| Minimum | 10.0365 |
|
|
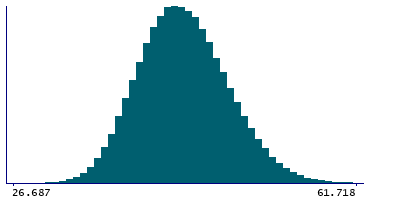
- Mean = 44.0565
- Std.dev = 4.572
- 40 items below graph minimum of 26.687
- 94 items above graph maximum of 61.718
|
4 Instances
Instance 0 : Initial assessment visit (2006-2010) at which participants were recruited and consent given
164,025 participants, 164,025 items
| Maximum | 71.42 |
| Decile 9 | 50.041 |
| Decile 8 | 47.837 |
| Decile 7 | 46.284 |
| Decile 6 | 44.997 |
| Median | 43.833 |
| Decile 4 | 42.668 |
| Decile 3 | 41.487 |
| Decile 2 | 40.146 |
| Decile 1 | 38.347 |
| Minimum | 10.425 |
|

|
- Mean = 44.0381
- Std.dev = 4.5771
- 31 items below graph minimum of 26.653
- 79 items above graph maximum of 61.735
|
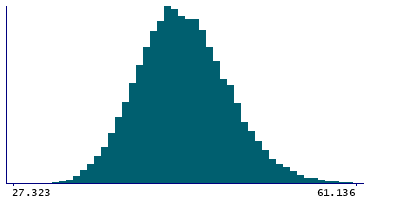
Instance 1 : First repeat assessment visit (2012-13)
19,890 participants, 19,890 items
| Maximum | 66.692 |
| Decile 9 | 49.812 |
| Decile 8 | 47.731 |
| Decile 7 | 46.214 |
| Decile 6 | 45.014 |
| Median | 43.833 |
| Decile 4 | 42.721 |
| Decile 3 | 41.575 |
| Decile 2 | 40.27 |
| Decile 1 | 38.488 |
| Minimum | 27.323 |
|
|
- Mean = 44.0474
- Std.dev = 4.44216
- 7 items above graph maximum of 61.136
|
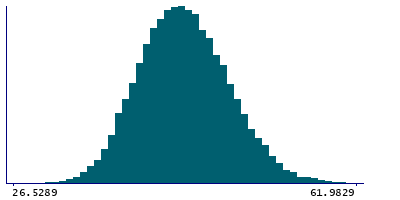
Instance 2 : Imaging visit (2014+)
34,622 participants, 34,622 items
| Maximum | 64.9639 |
| Decile 9 | 50.1473 |
| Decile 8 | 48.0306 |
| Decile 7 | 46.4784 |
| Decile 6 | 45.1731 |
| Median | 43.9737 |
| Decile 4 | 42.7919 |
| Decile 3 | 41.5748 |
| Decile 2 | 40.199 |
| Decile 1 | 38.3469 |
| Minimum | 10.0365 |
|
|
- Mean = 44.1534
- Std.dev = 4.6178
- 9 items below graph minimum of 26.5465
- 10 items above graph maximum of 61.9477
|
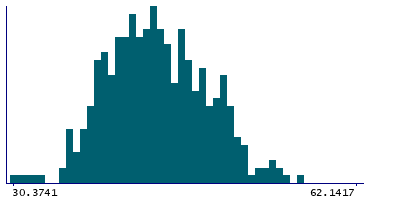
Instance 3 : First repeat imaging visit (2019+)
388 participants, 388 items
| Maximum | 64.717 |
| Decile 9 | 50.0238 |
| Decile 8 | 47.9248 |
| Decile 7 | 46.0903 |
| Decile 6 | 44.6528 |
| Median | 43.3916 |
| Decile 4 | 42.0863 |
| Decile 3 | 40.7722 |
| Decile 2 | 39.467 |
| Decile 1 | 37.9059 |
| Minimum | 30.3741 |
|
|
- Mean = 43.6605
- Std.dev = 4.7399
- 1 item above graph maximum of 62.1417
|


