Data
6,010 items of data are available, covering 6,003 participants.
Defined-instances run from 0 to 3, labelled using Instancing
2.
Units of measurement are m/s.
| Maximum | 1737.3 |
| Decile 9 | 1593.5 |
| Decile 8 | 1577.4 |
| Decile 7 | 1566.7 |
| Decile 6 | 1557.5 |
| Median | 1549.8 |
| Decile 4 | 1542.5 |
| Decile 3 | 1534.8 |
| Decile 2 | 1526.5 |
| Decile 1 | 1516.8 |
| Minimum | 300 |
|

|
- Mean = 1551.5
- Std.dev = 52.6548
- 8 items below graph minimum of 1440.1
- 12 items above graph maximum of 1670.2
|
4 Instances
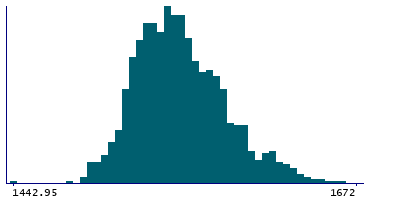
Instance 0 : Initial assessment visit (2006-2010) at which participants were recruited and consent given
1,228 participants, 1,228 items
| Maximum | 1737.3 |
| Decile 9 | 1595.65 |
| Decile 8 | 1579 |
| Decile 7 | 1568.45 |
| Decile 6 | 1558.5 |
| Median | 1551.3 |
| Decile 4 | 1544.1 |
| Decile 3 | 1536.25 |
| Decile 2 | 1528.6 |
| Decile 1 | 1519.3 |
| Minimum | 300 |
|
|
- Mean = 1551.9
- Std.dev = 69.6335
- 4 items below graph minimum of 1442.95
- 5 items above graph maximum of 1672
|
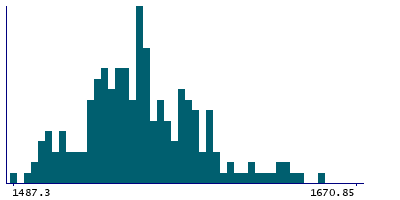
Instance 1 : First repeat assessment visit (2012-13)
205 participants, 205 items
| Maximum | 1724.9 |
| Decile 9 | 1593.85 |
| Decile 8 | 1581.7 |
| Decile 7 | 1569.65 |
| Decile 6 | 1559 |
| Median | 1554.8 |
| Decile 4 | 1546.9 |
| Decile 3 | 1540.1 |
| Decile 2 | 1532.3 |
| Decile 1 | 1516.85 |
| Minimum | 1487.3 |
|
|
- Mean = 1556.73
- Std.dev = 32.6933
- 1 item above graph maximum of 1670.85
|
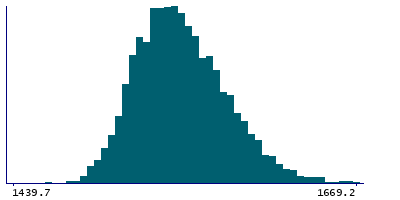
Instance 2 : Imaging visit (2014+)
4,567 participants, 4,567 items
| Maximum | 1699.4 |
| Decile 9 | 1592.8 |
| Decile 8 | 1576.9 |
| Decile 7 | 1566.05 |
| Decile 6 | 1557.2 |
| Median | 1549.2 |
| Decile 4 | 1541.8 |
| Decile 3 | 1534.15 |
| Decile 2 | 1525.65 |
| Decile 1 | 1516.2 |
| Minimum | 300 |
|
|
- Mean = 1551.17
- Std.dev = 47.9021
- 4 items below graph minimum of 1439.6
- 6 items above graph maximum of 1669.4
|
Instance 3 : First repeat imaging visit (2019+)
10 participants, 10 items
Too few values for statistical summary.


