Data
6,107 items of data are available, covering 6,097 participants.
Defined-instances run from 0 to 3, labelled using Instancing
2.
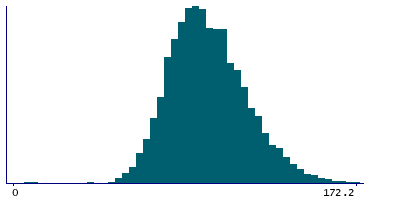
| Maximum | 197.6 |
| Decile 9 | 123.5 |
| Decile 8 | 113.6 |
| Decile 7 | 106.55 |
| Decile 6 | 101.2 |
| Median | 95.9 |
| Decile 4 | 91.2 |
| Decile 3 | 86.5 |
| Decile 2 | 81.2 |
| Decile 1 | 74.75 |
| Minimum | 4 |
|
|
- Mean = 97.7794
- Std.dev = 19.7904
- 9 items above graph maximum of 172.25
|
4 Instances
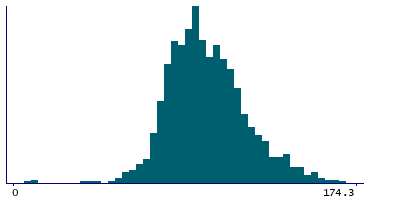
Instance 0 : Initial assessment visit (2006-2010) at which participants were recruited and consent given
1,272 participants, 1,272 items
| Maximum | 197.6 |
| Decile 9 | 125.35 |
| Decile 8 | 114.15 |
| Decile 7 | 107.3 |
| Decile 6 | 101.9 |
| Median | 96 |
| Decile 4 | 91.9 |
| Decile 3 | 87.2 |
| Decile 2 | 82 |
| Decile 1 | 76.4 |
| Minimum | 8.2 |
|
|
- Mean = 98.527
- Std.dev = 20.4155
- 3 items above graph maximum of 174.3
|
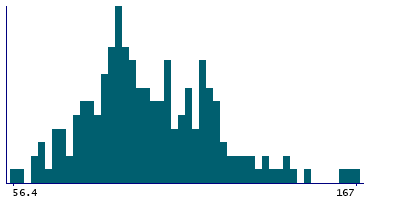
Instance 1 : First repeat assessment visit (2012-13)
189 participants, 189 items
| Maximum | 167 |
| Decile 9 | 126.95 |
| Decile 8 | 117.8 |
| Decile 7 | 111.8 |
| Decile 6 | 104.7 |
| Median | 97.35 |
| Decile 4 | 92.25 |
| Decile 3 | 89.15 |
| Decile 2 | 84.2 |
| Decile 1 | 76.45 |
| Minimum | 56.4 |
|
|
- Mean = 100.599
- Std.dev = 20.8359
|
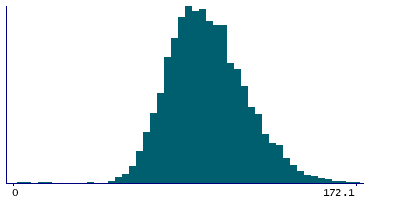
Instance 2 : Imaging visit (2014+)
4,636 participants, 4,636 items
| Maximum | 194.5 |
| Decile 9 | 123.25 |
| Decile 8 | 113.2 |
| Decile 7 | 106.2 |
| Decile 6 | 101 |
| Median | 95.9 |
| Decile 4 | 91 |
| Decile 3 | 86.2 |
| Decile 2 | 80.8 |
| Decile 1 | 74.2 |
| Minimum | 4 |
|
|
- Mean = 97.4625
- Std.dev = 19.5617
- 6 items above graph maximum of 172.3
|
Instance 3 : First repeat imaging visit (2019+)
10 participants, 10 items
Too few values for statistical summary.


