Data
6,107 items of data are available, covering 6,097 participants.
Defined-instances run from 0 to 3, labelled using Instancing
2.
Units of measurement are g/cm2.
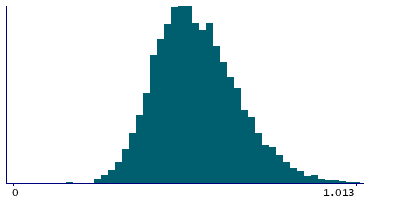
| Maximum | 1.173 |
| Decile 9 | 0.705 |
| Decile 8 | 0.642 |
| Decile 7 | 0.598 |
| Decile 6 | 0.564 |
| Median | 0.53 |
| Decile 4 | 0.501 |
| Decile 3 | 0.471 |
| Decile 2 | 0.438 |
| Decile 1 | 0.397 |
| Minimum | 0.147 |
|
|
- Mean = 0.542823
- Std.dev = 0.123901
- 9 items above graph maximum of 1.013
|
4 Instances
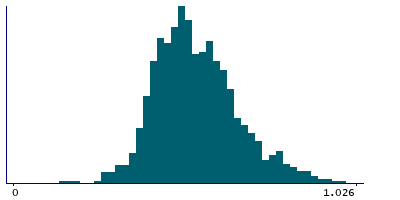
Instance 0 : Initial assessment visit (2006-2010) at which participants were recruited and consent given
1,272 participants, 1,272 items
| Maximum | 1.173 |
| Decile 9 | 0.717 |
| Decile 8 | 0.646 |
| Decile 7 | 0.603 |
| Decile 6 | 0.569 |
| Median | 0.531 |
| Decile 4 | 0.505 |
| Decile 3 | 0.476 |
| Decile 2 | 0.443 |
| Decile 1 | 0.408 |
| Minimum | 0.147 |
|
|
- Mean = 0.548575
- Std.dev = 0.126797
- 3 items above graph maximum of 1.026
|
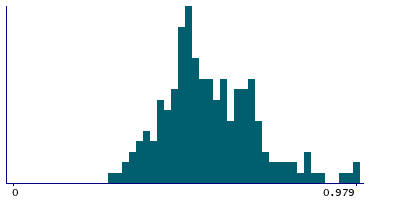
Instance 1 : First repeat assessment visit (2012-13)
189 participants, 189 items
| Maximum | 0.979 |
| Decile 9 | 0.726 |
| Decile 8 | 0.6685 |
| Decile 7 | 0.631 |
| Decile 6 | 0.586 |
| Median | 0.5395 |
| Decile 4 | 0.5065 |
| Decile 3 | 0.4875 |
| Decile 2 | 0.456 |
| Decile 1 | 0.4075 |
| Minimum | 0.281 |
|
|
- Mean = 0.559783
- Std.dev = 0.131706
|
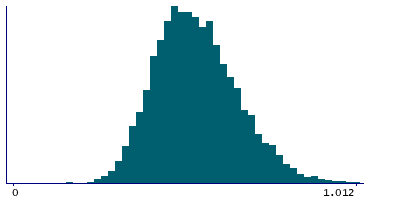
Instance 2 : Imaging visit (2014+)
4,636 participants, 4,636 items
| Maximum | 1.153 |
| Decile 9 | 0.703 |
| Decile 8 | 0.64 |
| Decile 7 | 0.596 |
| Decile 6 | 0.5625 |
| Median | 0.53 |
| Decile 4 | 0.499 |
| Decile 3 | 0.469 |
| Decile 2 | 0.435 |
| Decile 1 | 0.3935 |
| Minimum | 0.167 |
|
|
- Mean = 0.540575
- Std.dev = 0.122688
- 7 items above graph maximum of 1.0125
|
Instance 3 : First repeat imaging visit (2019+)
10 participants, 10 items
Too few values for statistical summary.


