Data
286,819 items of data are available, covering 236,313 participants.
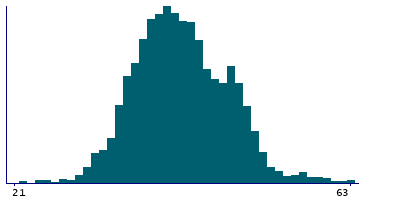
Defined-instances run from 0 to 3, labelled using Instancing
2.
| Maximum | 11304 |
| Decile 9 | 51 |
| Decile 8 | 48 |
| Decile 7 | 46 |
| Decile 6 | 44 |
| Median | 43 |
| Decile 4 | 41 |
| Decile 3 | 40 |
| Decile 2 | 38 |
| Decile 1 | 36 |
| Minimum | -1 |
|
|
- There are 74 distinct values.
- Mean = 43.3794
- Std.dev = 21.973
- 24 items below graph minimum of 21
- 1352 items above graph maximum of 66
|
4 Instances
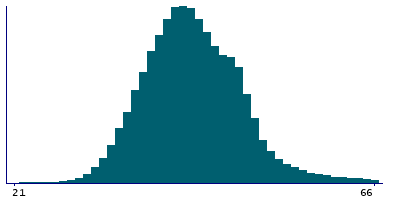
Instance 0 : Initial assessment visit (2006-2010) at which participants were recruited and consent given
170,565 participants, 170,565 items
| Maximum | 94 |
| Decile 9 | 51 |
| Decile 8 | 48 |
| Decile 7 | 46 |
| Decile 6 | 45 |
| Median | 43 |
| Decile 4 | 42 |
| Decile 3 | 40 |
| Decile 2 | 38 |
| Decile 1 | 36 |
| Minimum | 17 |
|
|
- There are 70 distinct values.
- Mean = 43.5593
- Std.dev = 6.35312
- 13 items below graph minimum of 21
- 899 items above graph maximum of 66
|
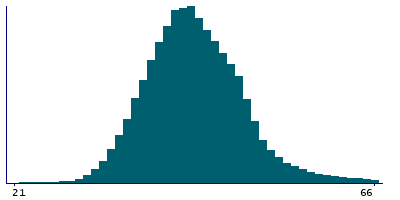
Instance 1 : First repeat assessment visit (2012-13)
20,208 participants, 20,208 items
| Maximum | 74 |
| Decile 9 | 49 |
| Decile 8 | 47 |
| Decile 7 | 45 |
| Decile 6 | 43 |
| Median | 42 |
| Decile 4 | 40 |
| Decile 3 | 39 |
| Decile 2 | 37 |
| Decile 1 | 35 |
| Minimum | 20 |
|
|
- There are 53 distinct values.
- Mean = 42.0484
- Std.dev = 5.88156
- 2 items below graph minimum of 21
- 84 items above graph maximum of 63
|
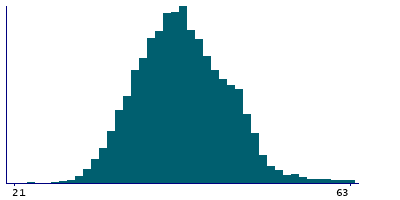
Instance 2 : Imaging visit (2014+)
84,010 participants, 84,010 items
| Maximum | 90 |
| Decile 9 | 51 |
| Decile 8 | 49 |
| Decile 7 | 47 |
| Decile 6 | 45 |
| Median | 43 |
| Decile 4 | 41 |
| Decile 3 | 40 |
| Decile 2 | 38 |
| Decile 1 | 36 |
| Minimum | -1 |
|
|
- There are 69 distinct values.
- Mean = 43.3848
- Std.dev = 6.53757
- 8 items below graph minimum of 21
- 391 items above graph maximum of 66
|
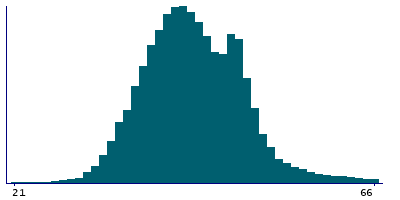
Instance 3 : First repeat imaging visit (2019+)
12,036 participants, 12,036 items
| Maximum | 11304 |
| Decile 9 | 50 |
| Decile 8 | 47 |
| Decile 7 | 45 |
| Decile 6 | 43 |
| Median | 42 |
| Decile 4 | 40 |
| Decile 3 | 39 |
| Decile 2 | 37 |
| Decile 1 | 35 |
| Minimum | 20 |
|
|
- There are 51 distinct values.
- Mean = 43.0272
- Std.dev = 102.828
- 29 items above graph maximum of 65
|
Notes
position of the notch
A digital volume pulse can be considered to be the summation of a direct and a reflected component. The direct component is due to transmission of a pressure wave from the left ventricle to the finger via the most direct route. The reflected component is formed by pressure transmitted from the heart to the lower body where it is reflected back up the aorta and thence to the finger. This is the time when when notch occurs in the waveform.


