Data
813,064 items of data are available, covering 90,855 participants.
Defined-instances run from 0 to 3, labelled using Instancing
2.
Array indices run from 0 to 15.
Units of measurement are milliseconds.
| Maximum | 501046 |
| Decile 9 | 10140 |
| Decile 8 | 7344 |
| Decile 7 | 6000 |
| Decile 6 | 5132 |
| Median | 4485 |
| Decile 4 | 3953 |
| Decile 3 | 3464 |
| Decile 2 | 2995 |
| Decile 1 | 2481 |
| Minimum | -1 |
|

|
- There are 12288 distinct values.
- Mean = 5887.18
- Std.dev = 5626.8
- 22761 items above graph maximum of 17799
|
3 Instances
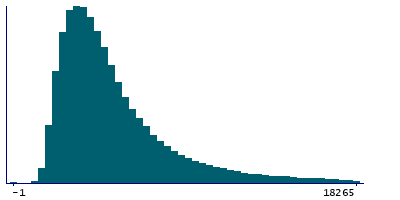
Instance 0 : Initial assessment visit (2006-2010) at which participants were recruited and consent given
51,604 participants, 418,884 items
| Maximum | 501046 |
| Decile 9 | 10406 |
| Decile 8 | 7500 |
| Decile 7 | 6125 |
| Decile 6 | 5250 |
| Median | 4594 |
| Decile 4 | 4047 |
| Decile 3 | 3547 |
| Decile 2 | 3063 |
| Decile 1 | 2547 |
| Minimum | -1 |
|
|
- There are 6673 distinct values.
- Mean = 6062.99
- Std.dev = 6000.72
- 12212 items above graph maximum of 18265
|
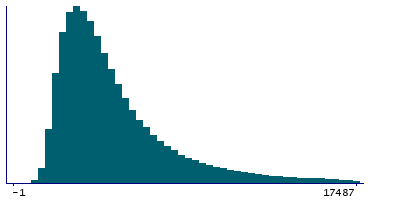
Instance 2 : Imaging visit (2014+)
42,949 participants, 352,422 items
| Maximum | 325933 |
| Decile 9 | 9953 |
| Decile 8 | 7223 |
| Decile 7 | 5897 |
| Decile 6 | 5039 |
| Median | 4399 |
| Decile 4 | 3869 |
| Decile 3 | 3386 |
| Decile 2 | 2933 |
| Decile 1 | 2434 |
| Minimum | -1 |
|
|
- There are 6078 distinct values.
- Mean = 5740.36
- Std.dev = 5266.16
- 9443 items above graph maximum of 17472
|
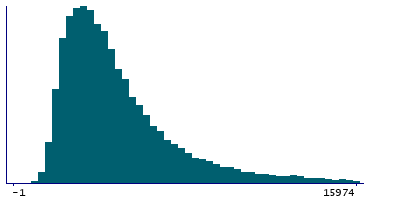
Instance 3 : First repeat imaging visit (2019+)
4,995 participants, 41,758 items
| Maximum | 210212 |
| Decile 9 | 9157 |
| Decile 8 | 6786 |
| Decile 7 | 5616 |
| Decile 6 | 4820 |
| Median | 4243 |
| Decile 4 | 3729 |
| Decile 3 | 3276 |
| Decile 2 | 2824 |
| Decile 1 | 2340 |
| Minimum | -1 |
|
|
- There are 2753 distinct values.
- Mean = 5362.62
- Std.dev = 4520.53
- 1056 items above graph maximum of 15974
|
Notes
When the participant touched the last key while entering a remembered number.
0 Related Data-Fields
There are no related data-fields


