Data
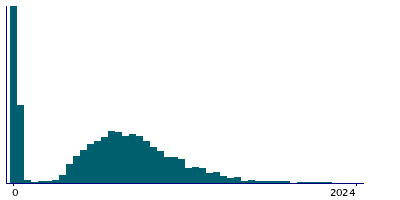
157,822 items of data are available, covering 148,622 participants.
Defined-instances run from 0 to 3, labelled using Instancing
2.
Units of measurement are seconds.
| Maximum | 3982 |
| Decile 9 | 880 |
| Decile 8 | 759 |
| Decile 7 | 688 |
| Decile 6 | 634 |
| Median | 584 |
| Decile 4 | 528 |
| Decile 3 | 436 |
| Decile 2 | 322 |
| Decile 1 | 251 |
| Minimum | 4 |
|
|
- There are 1909 distinct values.
- Mean = 575.778
- Std.dev = 261.985
- 781 items above graph maximum of 1509
|
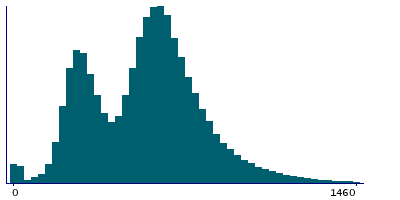
4 Instances
Instance 0 : Initial assessment visit (2006-2010) at which participants were recruited and consent given
117,732 participants, 117,732 items
| Maximum | 3583 |
| Decile 9 | 836 |
| Decile 8 | 726 |
| Decile 7 | 659 |
| Decile 6 | 606 |
| Median | 553 |
| Decile 4 | 482 |
| Decile 3 | 370 |
| Decile 2 | 301 |
| Decile 1 | 247.5 |
| Minimum | 14 |
|
|
- There are 1754 distinct values.
- Mean = 545.125
- Std.dev = 245.252
- 549 items above graph maximum of 1424
|
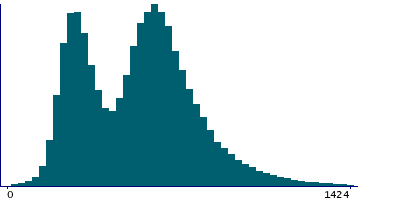
Instance 1 : First repeat assessment visit (2012-13)
20,307 participants, 20,307 items
| Maximum | 2680 |
| Decile 9 | 877 |
| Decile 8 | 786 |
| Decile 7 | 731 |
| Decile 6 | 689 |
| Median | 653 |
| Decile 4 | 622 |
| Decile 3 | 590 |
| Decile 2 | 555.5 |
| Decile 1 | 509 |
| Minimum | 22 |
|
|
- There are 1244 distinct values.
- Mean = 673.677
- Std.dev = 180.412
- 175 items above graph maximum of 1245
|
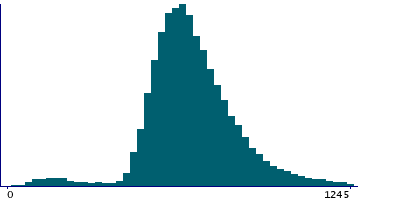
Instance 2 : Imaging visit (2014+)
4,182 participants, 4,182 items
| Maximum | 2426 |
| Decile 9 | 1097.5 |
| Decile 8 | 939 |
| Decile 7 | 819 |
| Decile 6 | 724.5 |
| Median | 642 |
| Decile 4 | 545 |
| Decile 3 | 427 |
| Decile 2 | 24 |
| Decile 1 | 13 |
| Minimum | 4 |
|
|
- There are 1127 distinct values.
- Mean = 599.175
- Std.dev = 411.834
- 3 items above graph maximum of 2182
|
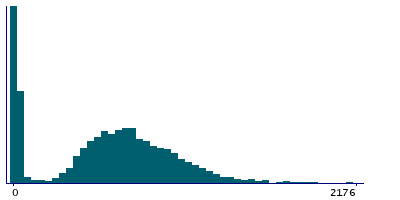
Instance 3 : First repeat imaging visit (2019+)
15,601 participants, 15,601 items
| Maximum | 3982 |
| Decile 9 | 1091 |
| Decile 8 | 918 |
| Decile 7 | 818 |
| Decile 6 | 744 |
| Median | 678 |
| Decile 4 | 610 |
| Decile 3 | 527 |
| Decile 2 | 428 |
| Decile 1 | 90 |
| Minimum | 4 |
|
|
- There are 1591 distinct values.
- Mean = 673.392
- Std.dev = 351.216
- 10 items above graph maximum of 2092
|
