Data
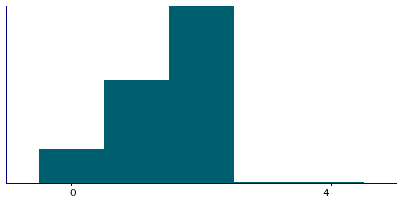
111,745 items of data are available, covering 108,714 participants.
Defined-instances run from 0 to 1, labelled using Instancing
2.
| Maximum | 5 |
| Decile 9 | 2 |
| Decile 8 | 2 |
| Decile 7 | 2 |
| Decile 6 | 2 |
| Median | 2 |
| Decile 4 | 1 |
| Decile 3 | 1 |
| Decile 2 | 1 |
| Decile 1 | 0 |
| Minimum | 0 |
|

|
- There are 6 distinct values.
- Mean = 1.47375
- Std.dev = 0.71674
- 206 items above graph maximum of 4
|
2 Instances
Instance 0 : Initial assessment visit (2006-2010) at which participants were recruited and consent given
95,966 participants, 95,966 items
| Maximum | 5 |
| Decile 9 | 2 |
| Decile 8 | 2 |
| Decile 7 | 2 |
| Decile 6 | 2 |
| Median | 2 |
| Decile 4 | 1 |
| Decile 3 | 1 |
| Decile 2 | 1 |
| Decile 1 | 0 |
| Minimum | 0 |
|
|
- There are 6 distinct values.
- Mean = 1.47371
- Std.dev = 0.715895
- 161 items above graph maximum of 4
|
Instance 1 : First repeat assessment visit (2012-13)
15,779 participants, 15,779 items
| Maximum | 5 |
| Decile 9 | 2 |
| Decile 8 | 2 |
| Decile 7 | 2 |
| Decile 6 | 2 |
| Median | 2 |
| Decile 4 | 1 |
| Decile 3 | 1 |
| Decile 2 | 1 |
| Decile 1 | 0 |
| Minimum | 0 |
|

|
- There are 6 distinct values.
- Mean = 1.47398
- Std.dev = 0.721856
- 45 items above graph maximum of 4
|


