Data
102,191 items of data are available, covering 88,768 participants.
Some values have special meanings defined by Data-Coding
1990.
Defined-instances run from 2 to 3, labelled using Instancing
2.
Units of measurement are deciseconds.
| Maximum | 6988 |
| Decile 9 | 898 |
| Decile 8 | 734 |
| Decile 7 | 646 |
| Decile 6 | 584 |
| Median | 534 |
| Decile 4 | 490 |
| Decile 3 | 449 |
| Decile 2 | 408 |
| Decile 1 | 358.5 |
| Minimum | 160 |
|
|
- There are 2113 distinct values.
- Mean = 599.753
- Std.dev = 280.821
- 1782 items above graph maximum of 1437
- 3419 items have value 0 (Trail not completed)
|
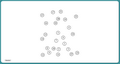
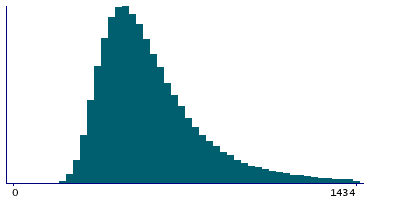
2 Instances
Instance 2 : Imaging visit (2014+)
82,252 participants, 82,252 items
| Maximum | 6988 |
| Decile 9 | 900 |
| Decile 8 | 736 |
| Decile 7 | 648 |
| Decile 6 | 585 |
| Median | 535 |
| Decile 4 | 491 |
| Decile 3 | 450 |
| Decile 2 | 408 |
| Decile 1 | 359 |
| Minimum | 160 |
|

|
- There are 2018 distinct values.
- Mean = 601.144
- Std.dev = 281.306
- 1434 items above graph maximum of 1441
- 2772 items have value 0 (Trail not completed)
|
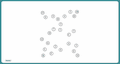
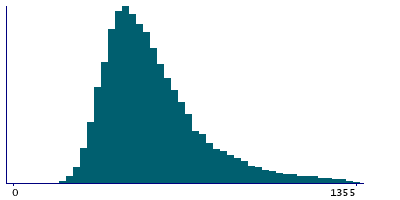
Instance 3 : First repeat imaging visit (2019+)
19,939 participants, 19,939 items
| Maximum | 5304 |
| Decile 9 | 889 |
| Decile 8 | 725 |
| Decile 7 | 637 |
| Decile 6 | 578 |
| Median | 529 |
| Decile 4 | 485 |
| Decile 3 | 446 |
| Decile 2 | 405 |
| Decile 1 | 357 |
| Minimum | 195 |
|
|
- There are 1432 distinct values.
- Mean = 594.025
- Std.dev = 278.743
- 355 items above graph maximum of 1421
- 647 items have value 0 (Trail not completed)
|