Data
167,175 items of data are available, covering 16,179 participants.
Defined-instances run from 2 to 3, labelled using Instancing
2.
Array indices run from 1 to 10.
Units of measurement are dioptre.
| Maximum | 12.5 |
| Decile 9 | 2.25 |
| Decile 8 | 1.5 |
| Decile 7 | 1 |
| Decile 6 | 0.5 |
| Median | 0.25 |
| Decile 4 | -0.25 |
| Decile 3 | -0.75 |
| Decile 2 | -1.5 |
| Decile 1 | -3 |
| Minimum | -18.5 |
|

|
- Mean = -0.0673905
- Std.dev = 2.43446
- 1405 items below graph minimum of -8.25
- 435 items above graph maximum of 7.5
|
2 Instances
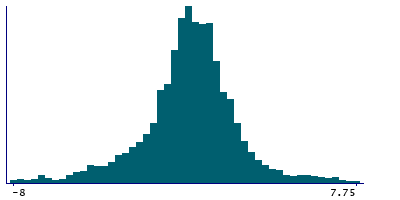
Instance 2 : Imaging visit (2014+)
3,512 participants, 34,872 items
| Maximum | 9.75 |
| Decile 9 | 2.5 |
| Decile 8 | 1.5 |
| Decile 7 | 1 |
| Decile 6 | 0.5 |
| Median | 0.25 |
| Decile 4 | -0.25 |
| Decile 3 | -0.75 |
| Decile 2 | -1.25 |
| Decile 1 | -2.75 |
| Minimum | -15 |
|
|
- Mean = 0.0260668
- Std.dev = 2.4234
- 277 items below graph minimum of -8
- 71 items above graph maximum of 7.75
|
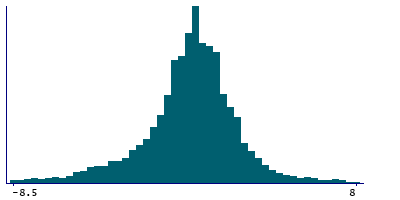
Instance 3 : First repeat imaging visit (2019+)
13,349 participants, 132,303 items
| Maximum | 12.5 |
| Decile 9 | 2.25 |
| Decile 8 | 1.5 |
| Decile 7 | 1 |
| Decile 6 | 0.5 |
| Median | 0 |
| Decile 4 | -0.25 |
| Decile 3 | -0.75 |
| Decile 2 | -1.5 |
| Decile 1 | -3 |
| Minimum | -18.5 |
|
|
- Mean = -0.0920236
- Std.dev = 2.43677
- 1149 items below graph minimum of -8.25
- 334 items above graph maximum of 7.5
|
Notes
Spherical equivalent value (left)
0 Related Data-Fields
There are no related data-fields
0 Resources
There are no matching Resources
