Data
1,248,411 items of data are available, covering 501,109 participants.
Defined-instances run from 0 to 3, labelled using Instancing
2.
Array indices run from 0 to 1.
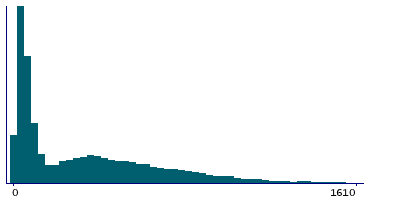
Units of measurement are seconds.
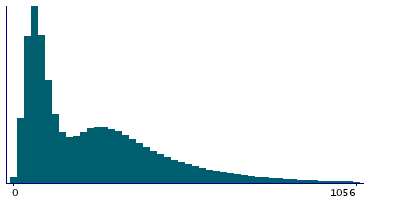
| Maximum | 8522 |
| Decile 9 | 562 |
| Decile 8 | 416 |
| Decile 7 | 331 |
| Decile 6 | 264 |
| Median | 194 |
| Decile 4 | 124 |
| Decile 3 | 89 |
| Decile 2 | 67 |
| Decile 1 | 47 |
| Minimum | 3 |
|
|
- There are 2246 distinct values.
- Mean = 259.087
- Std.dev = 236.693
- 12487 items above graph maximum of 1077
|
4 Instances
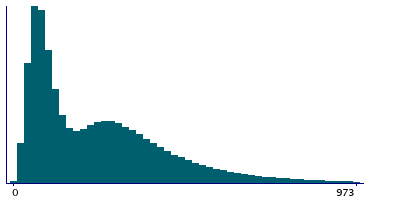
Instance 0 : Initial assessment visit (2006-2010) at which participants were recruited and consent given
501,076 participants, 1,001,702 items
| Maximum | 4281 |
| Decile 9 | 513 |
| Decile 8 | 391 |
| Decile 7 | 316 |
| Decile 6 | 255 |
| Median | 193 |
| Decile 4 | 129 |
| Decile 3 | 95 |
| Decile 2 | 73 |
| Decile 1 | 53 |
| Minimum | 5 |
|
|
- There are 2066 distinct values.
- Mean = 246.843
- Std.dev = 210.697
- 9691 items above graph maximum of 973
|
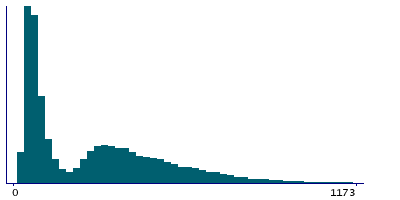
Instance 1 : First repeat assessment visit (2012-13)
20,313 participants, 40,623 items
| Maximum | 2095 |
| Decile 9 | 611 |
| Decile 8 | 475 |
| Decile 7 | 381 |
| Decile 6 | 308 |
| Median | 217 |
| Decile 4 | 102 |
| Decile 3 | 76 |
| Decile 2 | 61 |
| Decile 1 | 49 |
| Minimum | 10 |
|
|
- There are 1202 distinct values.
- Mean = 274.1
- Std.dev = 239.64
- 115 items above graph maximum of 1173
|
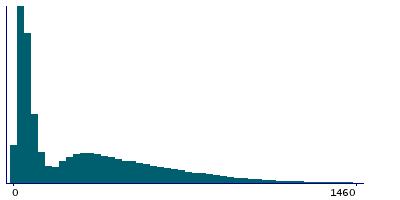
Instance 2 : Imaging visit (2014+)
89,066 participants, 177,658 items
| Maximum | 8522 |
| Decile 9 | 771 |
| Decile 8 | 569 |
| Decile 7 | 431 |
| Decile 6 | 320 |
| Median | 205 |
| Decile 4 | 87 |
| Decile 3 | 59 |
| Decile 2 | 42 |
| Decile 1 | 28 |
| Minimum | 3 |
|
|
- There are 1988 distinct values.
- Mean = 312.511
- Std.dev = 326.566
- 861 items above graph maximum of 1514
|
Instance 3 : First repeat imaging visit (2019+)
14,294 participants, 28,428 items
| Maximum | 2932 |
| Decile 9 | 831.5 |
| Decile 8 | 624 |
| Decile 7 | 477 |
| Decile 6 | 349 |
| Median | 213 |
| Decile 4 | 93 |
| Decile 3 | 61 |
| Decile 2 | 42 |
| Decile 1 | 26 |
| Minimum | 4 |
|
|
- There are 1544 distinct values.
- Mean = 335.203
- Std.dev = 343.855
- 80 items above graph maximum of 1637
|
Notes
The time since interview start at which the blood pressure screen was shown is useful because it can be used to calculate the interval between the two measurements of blood pressure. This interval is variable because it, for efficiency reasons, it was impractical to use a fixed time during the UK Biobank Assessments.
0 Related Data-Fields
There are no related data-fields


