Data
1,268,625 items of data are available, covering 393,104 participants.
Some values have special meanings defined by Data-Coding
13.
Defined-instances run from 0 to 3, labelled using Instancing
2.
Array indices run from 0 to 33.
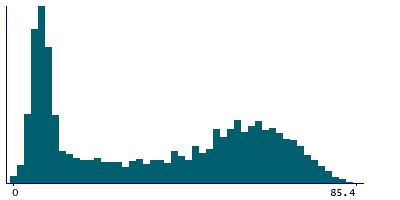
Units of measurement are years.
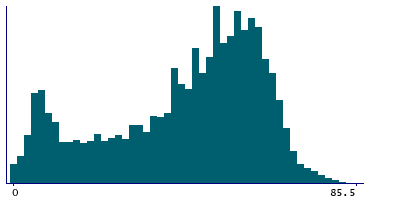
| Maximum | 85.4 |
| Decile 9 | 63.5 |
| Decile 8 | 59.5 |
| Decile 7 | 55.5 |
| Decile 6 | 51.5 |
| Median | 47.5 |
| Decile 4 | 42.4 |
| Decile 3 | 35.5 |
| Decile 2 | 24.4 |
| Decile 1 | 10.5 |
| Minimum | 0 |
|
|
- Mean = 42.6444
- Std.dev = 18.8849
- 239 items have value -3 (Preferred not to answer)
- 46269 items have value -1 (Date uncertain or unknown)
|
4 Instances
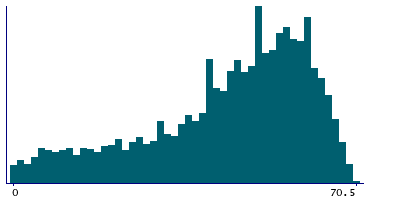
Instance 0 : Initial assessment visit (2006-2010) at which participants were recruited and consent given
374,934 participants, 902,046 items
| Maximum | 70.5 |
| Decile 9 | 62.3 |
| Decile 8 | 58.5 |
| Decile 7 | 55.5 |
| Decile 6 | 51.5 |
| Median | 48.2 |
| Decile 4 | 43.5 |
| Decile 3 | 38.5 |
| Decile 2 | 29.5 |
| Decile 1 | 16.5 |
| Minimum | 0 |
|
|
- Mean = 43.8649
- Std.dev = 16.816
- 222 items have value -3 (Preferred not to answer)
- 32273 items have value -1 (Date uncertain or unknown)
|
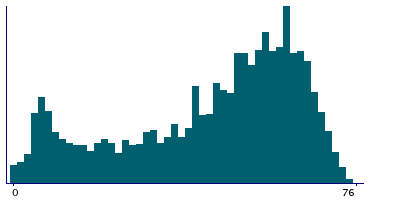
Instance 1 : First repeat assessment visit (2012-13)
17,003 participants, 54,869 items
| Maximum | 76 |
| Decile 9 | 64.9 |
| Decile 8 | 60.8 |
| Decile 7 | 57.5 |
| Decile 6 | 53.5 |
| Median | 49.5 |
| Decile 4 | 43.6 |
| Decile 3 | 35.5 |
| Decile 2 | 23.7 |
| Decile 1 | 10 |
| Minimum | 0 |
|
|
- Mean = 43.5966
- Std.dev = 19.5583
- 5 items have value -3 (Preferred not to answer)
- 819 items have value -1 (Date uncertain or unknown)
|
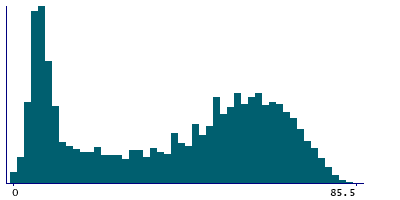
Instance 2 : Imaging visit (2014+)
57,193 participants, 242,452 items
| Maximum | 85.4 |
| Decile 9 | 67.9 |
| Decile 8 | 62.2 |
| Decile 7 | 57 |
| Decile 6 | 51.5 |
| Median | 44.5 |
| Decile 4 | 32.1 |
| Decile 3 | 17.5 |
| Decile 2 | 8.5 |
| Decile 1 | 5.5 |
| Minimum | 0 |
|
|
- Mean = 38.5975
- Std.dev = 23.9905
- 12 items have value -3 (Preferred not to answer)
- 12095 items have value -1 (Date uncertain or unknown)
|
Instance 3 : First repeat imaging visit (2019+)
5,343 participants, 22,750 items
| Maximum | 84 |
| Decile 9 | 66.7 |
| Decile 8 | 60.5 |
| Decile 7 | 54.9 |
| Decile 6 | 48.4 |
| Median | 36.7 |
| Decile 4 | 21.5 |
| Decile 3 | 10.5 |
| Decile 2 | 7.5 |
| Decile 1 | 5.5 |
| Minimum | 0 |
|
|
- Mean = 35.0839
- Std.dev = 24.4337
- 1082 items have value -1 (Date uncertain or unknown)
|
Notes
This is the interpolated time when the participant indicated the corresponding condition was first diagnosed by a doctor, given as their estimated age.
- If the participant gave a calendar year, then the best-fit time is their age at the mid-point of that year. For example if the year was given as 1970, and the participant was born on 1 April 1950, then their age on 1st July 1970 is 20.25
then the value presented is 1970.5 - If the participant gave their age then the value presented is the fractional year corresponding to the mid-point of that age. For example, if the participant said they were 30 years old then the value is 30.5
- Interpolated values before the date of birth were truncated forwards to that time.
- Interpolated values after the time of data acquisition were truncated back to that time.
Coding 13 defines 2 special values:
- -1 represents "Date uncertain or unknown"
- -3 represents "Preferred not to answer"


