Data
281,955 items of data are available, covering 229,934 participants.
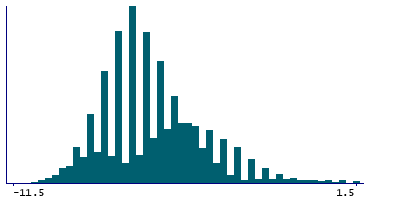
Defined-instances run from 0 to 3, labelled using Instancing
2.
| Maximum | 8 |
| Decile 9 | -3.5 |
| Decile 8 | -4.5 |
| Decile 7 | -5.5 |
| Decile 6 | -6 |
| Median | -6.5 |
| Decile 4 | -7 |
| Decile 3 | -7.5 |
| Decile 2 | -8 |
| Decile 1 | -8.5 |
| Minimum | -11.5 |
|
|
- Mean = -6.02586
- Std.dev = 2.33264
- 3399 items above graph maximum of 1.5
|
4 Instances
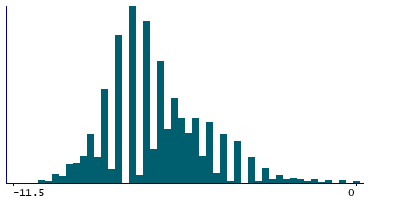
Instance 0 : Initial assessment visit (2006-2010) at which participants were recruited and consent given
163,086 participants, 163,086 items
| Maximum | 8 |
| Decile 9 | -4.5 |
| Decile 8 | -5.5 |
| Decile 7 | -6 |
| Decile 6 | -6.5 |
| Median | -7 |
| Decile 4 | -7 |
| Decile 3 | -7.5 |
| Decile 2 | -8 |
| Decile 1 | -8.5 |
| Minimum | -11.5 |
|
|
- Mean = -6.54661
- Std.dev = 2.10867
- 1866 items above graph maximum of 0
|
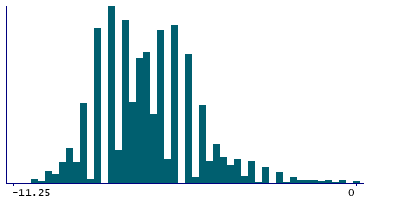
Instance 1 : First repeat assessment visit (2012-13)
19,837 participants, 19,837 items
| Maximum | 8 |
| Decile 9 | -4.5 |
| Decile 8 | -5.5 |
| Decile 7 | -6 |
| Decile 6 | -6.5 |
| Median | -7 |
| Decile 4 | -7.5 |
| Decile 3 | -7.5 |
| Decile 2 | -8 |
| Decile 1 | -8.5 |
| Minimum | -11.25 |
|
|
- Mean = -6.6965
- Std.dev = 2.01019
- 208 items above graph maximum of 0
|
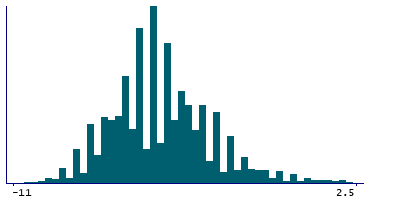
Instance 2 : Imaging visit (2014+)
86,639 participants, 86,639 items
| Maximum | 8 |
| Decile 9 | -2.5 |
| Decile 8 | -3.5 |
| Decile 7 | -4.5 |
| Decile 6 | -5 |
| Median | -5.5 |
| Decile 4 | -6 |
| Decile 3 | -6.5 |
| Decile 2 | -7 |
| Decile 1 | -7.5 |
| Minimum | -11 |
|
|
- Mean = -5.03176
- Std.dev = 2.41004
- 1460 items above graph maximum of 2.5
|
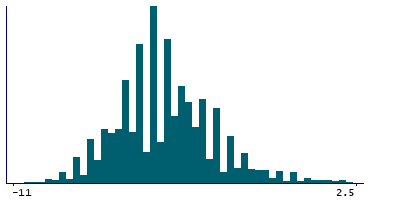
Instance 3 : First repeat imaging visit (2019+)
12,393 participants, 12,393 items
| Maximum | 8 |
| Decile 9 | -2.5 |
| Decile 8 | -3.5 |
| Decile 7 | -4.5 |
| Decile 6 | -5 |
| Median | -5.5 |
| Decile 4 | -6 |
| Decile 3 | -6.5 |
| Decile 2 | -7 |
| Decile 1 | -7.5 |
| Minimum | -11 |
|
|
- Mean = -5.04928
- Std.dev = 2.46073
- 210 items above graph maximum of 2.5
|


