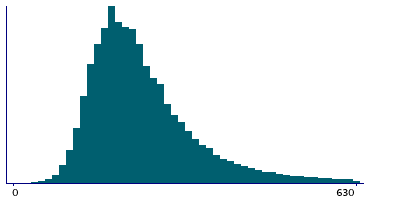
Data
189,378 items of data are available, covering 144,717 participants.
Defined-instances run from 0 to 1, labelled using Instancing
178.
Units of measurement are deciseconds.
| Maximum | 9999 |
| Decile 9 | 385 |
| Decile 8 | 310 |
| Decile 7 | 270 |
| Decile 6 | 240 |
| Median | 220 |
| Decile 4 | 200 |
| Decile 3 | 180 |
| Decile 2 | 160 |
| Decile 1 | 140 |
| Minimum | 6 |
|
|
- There are 1568 distinct values.
- Mean = 252.611
- Std.dev = 187.381
- 4071 items above graph maximum of 630
|
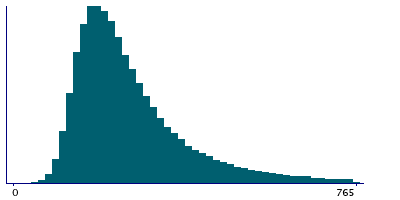
2 Instances
Instance 0 : Assessment run 2014
107,482 participants, 107,482 items
| Maximum | 9999 |
| Decile 9 | 453 |
| Decile 8 | 349 |
| Decile 7 | 295 |
| Decile 6 | 259 |
| Median | 231 |
| Decile 4 | 208 |
| Decile 3 | 186 |
| Decile 2 | 165 |
| Decile 1 | 141 |
| Minimum | 6 |
|
|
- There are 1567 distinct values.
- Mean = 279.449
- Std.dev = 237.053
- 2203 items above graph maximum of 765
|
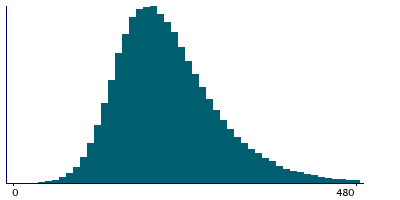
Instance 1 : Assessment run 2021
81,896 participants, 81,896 items
| Maximum | 750 |
| Decile 9 | 310 |
| Decile 8 | 270 |
| Decile 7 | 240 |
| Decile 6 | 220 |
| Median | 210 |
| Decile 4 | 190 |
| Decile 3 | 180 |
| Decile 2 | 160 |
| Decile 1 | 140 |
| Minimum | 10 |
|
|
- There are 68 distinct values.
- Mean = 217.389
- Std.dev = 72.5026
- 328 items above graph maximum of 480
|
Notes
Indicates how long a participant viewed question FI6 before selecting their answer and clicking Next.
1 Related Data-Field
| Field ID | Description | Relationship |
|---|
| 20175 | FI6 : conditional arithmetic | Current Field is the duration spent viewing before entering the answer in Field 20175 |