Data
290,845 items of data are available, covering 275,144 participants.
Defined-instances run from 0 to 1, labelled using Instancing
2.
Units of measurement are mmol/l.
| Maximum | 1.90314 |
| Decile 9 | 0.463891 |
| Decile 8 | 0.4256 |
| Decile 7 | 0.399589 |
| Decile 6 | 0.378369 |
| Median | 0.359347 |
| Decile 4 | 0.341085 |
| Decile 3 | 0.322612 |
| Decile 2 | 0.302278 |
| Decile 1 | 0.275966 |
| Minimum | 0.104091 |
|
|
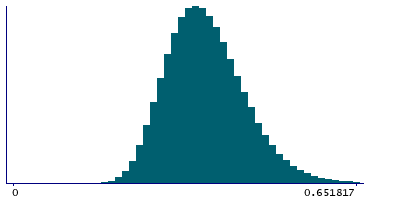
- Mean = 0.366239
- Std.dev = 0.075679
- 693 items above graph maximum of 0.651817
|
2 Instances
Instance 0 : Initial assessment visit (2006-2010) at which participants were recruited and consent given
274,144 participants, 274,144 items
| Maximum | 1.90314 |
| Decile 9 | 0.463624 |
| Decile 8 | 0.425354 |
| Decile 7 | 0.39927 |
| Decile 6 | 0.377961 |
| Median | 0.358938 |
| Decile 4 | 0.34068 |
| Decile 3 | 0.322203 |
| Decile 2 | 0.301828 |
| Decile 1 | 0.275524 |
| Minimum | 0.104091 |
|

|
- Mean = 0.365883
- Std.dev = 0.0757895
- 652 items above graph maximum of 0.651725
|
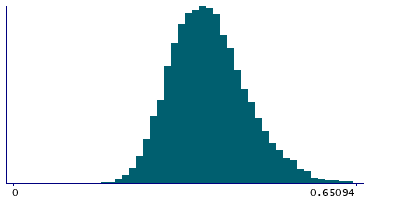
Instance 1 : First repeat assessment visit (2012-13)
16,701 participants, 16,701 items
| Maximum | 0.822273 |
| Decile 9 | 0.467682 |
| Decile 8 | 0.429708 |
| Decile 7 | 0.404488 |
| Decile 6 | 0.384262 |
| Median | 0.366093 |
| Decile 4 | 0.348127 |
| Decile 3 | 0.329742 |
| Decile 2 | 0.309647 |
| Decile 1 | 0.284423 |
| Minimum | 0.148529 |
|
|
- Mean = 0.372073
- Std.dev = 0.0735975
- 42 items above graph maximum of 0.65094
|


