Data
290,953 items of data are available, covering 275,241 participants.
Defined-instances run from 0 to 1, labelled using Instancing
2.
Units of measurement are mmol/l.
| Maximum | 2.7676 |
| Decile 9 | 1.0497 |
| Decile 8 | 0.92112 |
| Decile 7 | 0.833355 |
| Decile 6 | 0.7614 |
| Median | 0.697 |
| Decile 4 | 0.63466 |
| Decile 3 | 0.5722 |
| Decile 2 | 0.50467 |
| Decile 1 | 0.420725 |
| Minimum | 0.063553 |
|

|
- Mean = 0.720246
- Std.dev = 0.247881
- 359 items above graph maximum of 1.67868
|
2 Instances
Instance 0 : Initial assessment visit (2006-2010) at which participants were recruited and consent given
274,250 participants, 274,250 items
| Maximum | 2.7676 |
| Decile 9 | 1.0506 |
| Decile 8 | 0.92193 |
| Decile 7 | 0.83405 |
| Decile 6 | 0.76203 |
| Median | 0.6976 |
| Decile 4 | 0.63514 |
| Decile 3 | 0.57263 |
| Decile 2 | 0.50507 |
| Decile 1 | 0.42111 |
| Minimum | 0.063553 |
|

|
- Mean = 0.720881
- Std.dev = 0.248202
- 343 items above graph maximum of 1.68009
|
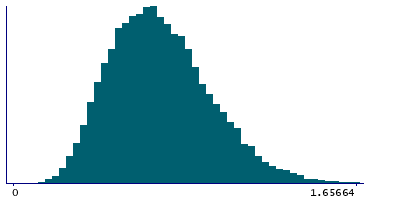
Instance 1 : First repeat assessment visit (2012-13)
16,703 participants, 16,703 items
| Maximum | 2.1496 |
| Decile 9 | 1.03615 |
| Decile 8 | 0.907025 |
| Decile 7 | 0.82121 |
| Decile 6 | 0.751255 |
| Median | 0.687445 |
| Decile 4 | 0.62731 |
| Decile 3 | 0.56444 |
| Decile 2 | 0.49819 |
| Decile 1 | 0.41566 |
| Minimum | 0.12138 |
|
|
- Mean = 0.709817
- Std.dev = 0.242304
- 13 items above graph maximum of 1.65664
|


