Data
290,954 items of data are available, covering 275,242 participants.
Defined-instances run from 0 to 1, labelled using Instancing
2.
Units of measurement are mmol/l.
| Maximum | 8.1154 |
| Decile 9 | 3.5016 |
| Decile 8 | 3.1466 |
| Decile 7 | 2.9047 |
| Decile 6 | 2.7002 |
| Median | 2.5147 |
| Decile 4 | 2.3341 |
| Decile 3 | 2.1429 |
| Decile 2 | 1.9263 |
| Decile 1 | 1.63745 |
| Minimum | 0 |
|
|
- Mean = 2.55109
- Std.dev = 0.737455
- 287 items above graph maximum of 5.36575
|
2 Instances
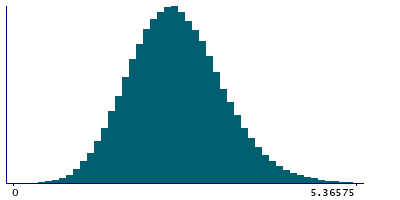
Instance 0 : Initial assessment visit (2006-2010) at which participants were recruited and consent given
274,251 participants, 274,251 items
| Maximum | 8.1154 |
| Decile 9 | 3.5021 |
| Decile 8 | 3.1475 |
| Decile 7 | 2.9056 |
| Decile 6 | 2.7013 |
| Median | 2.5163 |
| Decile 4 | 2.3353 |
| Decile 3 | 2.1447 |
| Decile 2 | 1.9289 |
| Decile 1 | 1.64015 |
| Minimum | 0 |
|

|
- Mean = 2.55258
- Std.dev = 0.736879
- 274 items above graph maximum of 5.36405
|
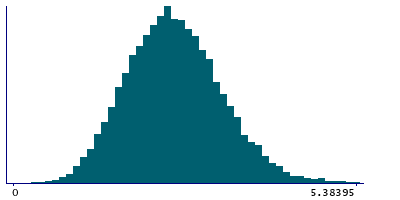
Instance 1 : First repeat assessment visit (2012-13)
16,703 participants, 16,703 items
| Maximum | 6.3769 |
| Decile 9 | 3.4911 |
| Decile 8 | 3.13075 |
| Decile 7 | 2.8872 |
| Decile 6 | 2.6811 |
| Median | 2.48885 |
| Decile 4 | 2.3121 |
| Decile 3 | 2.10995 |
| Decile 2 | 1.88415 |
| Decile 1 | 1.59825 |
| Minimum | 0.1645 |
|
|
- Mean = 2.52667
- Std.dev = 0.746432
- 15 items above graph maximum of 5.38395
|


