Data
290,953 items of data are available, covering 275,241 participants.
Defined-instances run from 0 to 1, labelled using Instancing
2.
Units of measurement are mmol/l.
| Maximum | 1.4024 |
| Decile 9 | 0.62213 |
| Decile 8 | 0.56422 |
| Decile 7 | 0.52471 |
| Decile 6 | 0.49153 |
| Median | 0.46109 |
| Decile 4 | 0.43128 |
| Decile 3 | 0.399955 |
| Decile 2 | 0.36413 |
| Decile 1 | 0.31529 |
| Minimum | 7.1221e-13 |
|

|
- Mean = 0.466115
- Std.dev = 0.121948
- 300 items above graph maximum of 0.92897
|
2 Instances
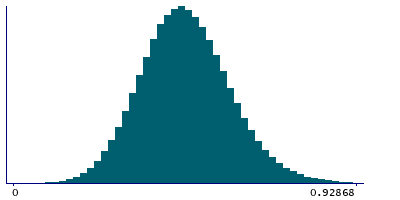
Instance 0 : Initial assessment visit (2006-2010) at which participants were recruited and consent given
274,250 participants, 274,250 items
| Maximum | 1.4024 |
| Decile 9 | 0.62219 |
| Decile 8 | 0.56431 |
| Decile 7 | 0.52482 |
| Decile 6 | 0.49164 |
| Median | 0.46122 |
| Decile 4 | 0.43152 |
| Decile 3 | 0.40022 |
| Decile 2 | 0.36456 |
| Decile 1 | 0.3157 |
| Minimum | 7.1221e-13 |
|
|
- Mean = 0.466319
- Std.dev = 0.121826
- 281 items above graph maximum of 0.92868
|
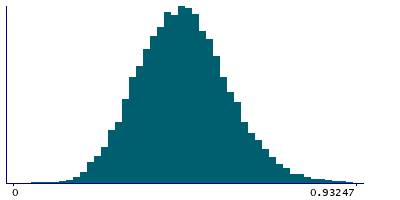
Instance 1 : First repeat assessment visit (2012-13)
16,703 participants, 16,703 items
| Maximum | 1.0896 |
| Decile 9 | 0.62087 |
| Decile 8 | 0.562605 |
| Decile 7 | 0.522665 |
| Decile 6 | 0.489115 |
| Median | 0.458635 |
| Decile 4 | 0.427185 |
| Decile 3 | 0.394495 |
| Decile 2 | 0.357585 |
| Decile 1 | 0.30927 |
| Minimum | 0.0070486 |
|
|
- Mean = 0.462764
- Std.dev = 0.123885
- 19 items above graph maximum of 0.93247
|


