Data
290,953 items of data are available, covering 275,241 participants.
Defined-instances run from 0 to 1, labelled using Instancing
2.
Units of measurement are mmol/l.
| Maximum | 7.2381 |
| Decile 9 | 3.2905 |
| Decile 8 | 2.9918 |
| Decile 7 | 2.7889 |
| Decile 6 | 2.6198 |
| Median | 2.4682 |
| Decile 4 | 2.32145 |
| Decile 3 | 2.1665 |
| Decile 2 | 1.9922 |
| Decile 1 | 1.7634 |
| Minimum | 0.23103 |
|
|
- Mean = 2.50478
- Std.dev = 0.606307
- 328 items above graph maximum of 4.8176
|
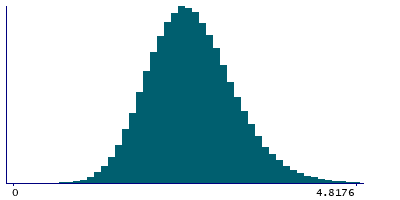
2 Instances
Instance 0 : Initial assessment visit (2006-2010) at which participants were recruited and consent given
274,250 participants, 274,250 items
| Maximum | 7.2381 |
| Decile 9 | 3.2915 |
| Decile 8 | 2.9925 |
| Decile 7 | 2.7894 |
| Decile 6 | 2.6208 |
| Median | 2.469 |
| Decile 4 | 2.3226 |
| Decile 3 | 2.1674 |
| Decile 2 | 1.9939 |
| Decile 1 | 1.7651 |
| Minimum | 0.23103 |
|

|
- Mean = 2.50584
- Std.dev = 0.606005
- 313 items above graph maximum of 4.8179
|
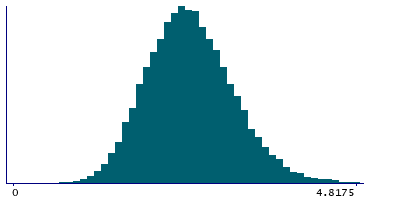
Instance 1 : First repeat assessment visit (2012-13)
16,703 participants, 16,703 items
| Maximum | 5.8536 |
| Decile 9 | 3.27615 |
| Decile 8 | 2.9807 |
| Decile 7 | 2.77725 |
| Decile 6 | 2.60425 |
| Median | 2.4519 |
| Decile 4 | 2.30465 |
| Decile 3 | 2.14795 |
| Decile 2 | 1.96545 |
| Decile 1 | 1.7348 |
| Minimum | 0.42495 |
|
|
- Mean = 2.48734
- Std.dev = 0.610982
- 15 items above graph maximum of 4.8175
|


