Data
290,954 items of data are available, covering 275,242 participants.
Defined-instances run from 0 to 1, labelled using Instancing
2.
Units of measurement are ratio.
| Maximum | 3.5867 |
| Decile 9 | 0.81491 |
| Decile 8 | 0.7287 |
| Decile 7 | 0.66913 |
| Decile 6 | 0.62027 |
| Median | 0.57706 |
| Decile 4 | 0.53575 |
| Decile 3 | 0.49472 |
| Decile 2 | 0.45068 |
| Decile 1 | 0.3958 |
| Minimum | 0.064523 |
|
|
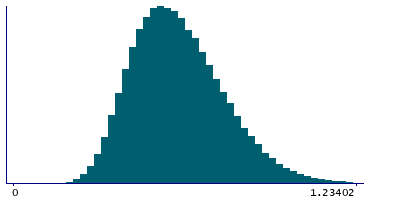
- Mean = 0.594061
- Std.dev = 0.165573
- 346 items above graph maximum of 1.23402
|
2 Instances
Instance 0 : Initial assessment visit (2006-2010) at which participants were recruited and consent given
274,251 participants, 274,251 items
| Maximum | 3.5867 |
| Decile 9 | 0.81654 |
| Decile 8 | 0.730415 |
| Decile 7 | 0.670515 |
| Decile 6 | 0.62155 |
| Median | 0.578335 |
| Decile 4 | 0.53681 |
| Decile 3 | 0.49561 |
| Decile 2 | 0.45138 |
| Decile 1 | 0.39617 |
| Minimum | 0.064523 |
|

|
- Mean = 0.595231
- Std.dev = 0.166096
- 327 items above graph maximum of 1.23691
|
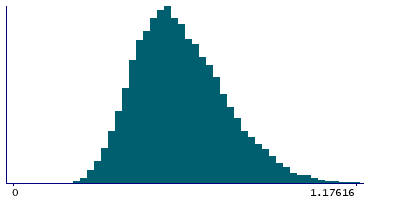
Instance 1 : First repeat assessment visit (2012-13)
16,703 participants, 16,703 items
| Maximum | 1.5741 |
| Decile 9 | 0.783155 |
| Decile 8 | 0.700775 |
| Decile 7 | 0.645465 |
| Decile 6 | 0.597895 |
| Median | 0.557265 |
| Decile 4 | 0.51987 |
| Decile 3 | 0.482645 |
| Decile 2 | 0.440315 |
| Decile 1 | 0.39015 |
| Minimum | 0.13053 |
|
|
- Mean = 0.574859
- Std.dev = 0.155496
- 22 items above graph maximum of 1.17616
|


