Data
290,562 items of data are available, covering 274,893 participants.
Defined-instances run from 0 to 1, labelled using Instancing
2.
Units of measurement are mmol/l.
| Maximum | 0.65739 |
| Decile 9 | 0.079085 |
| Decile 8 | 0.07401 |
| Decile 7 | 0.070531 |
| Decile 6 | 0.067661 |
| Median | 0.065079 |
| Decile 4 | 0.062555 |
| Decile 3 | 0.059888 |
| Decile 2 | 0.0568405 |
| Decile 1 | 0.052661 |
| Minimum | 0.021156 |
|
|
- Mean = 0.0656298
- Std.dev = 0.0114244
- 375 items above graph maximum of 0.105509
|
2 Instances
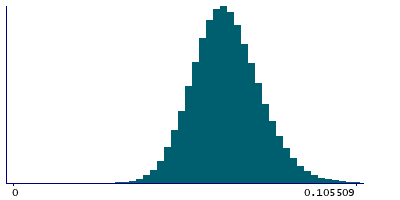
Instance 0 : Initial assessment visit (2006-2010) at which participants were recruited and consent given
273,883 participants, 273,883 items
| Maximum | 0.65739 |
| Decile 9 | 0.078958 |
| Decile 8 | 0.0739 |
| Decile 7 | 0.070414 |
| Decile 6 | 0.067558 |
| Median | 0.064979 |
| Decile 4 | 0.062458 |
| Decile 3 | 0.059796 |
| Decile 2 | 0.05676 |
| Decile 1 | 0.052581 |
| Minimum | 0.021156 |
|

|
- Mean = 0.0655264
- Std.dev = 0.0113705
- 353 items above graph maximum of 0.105335
|
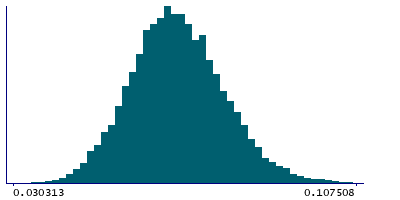
Instance 1 : First repeat assessment visit (2012-13)
16,679 participants, 16,679 items
| Maximum | 0.62948 |
| Decile 9 | 0.080834 |
| Decile 8 | 0.075793 |
| Decile 7 | 0.072421 |
| Decile 6 | 0.069453 |
| Median | 0.0667915 |
| Decile 4 | 0.064202 |
| Decile 3 | 0.061467 |
| Decile 2 | 0.058498 |
| Decile 1 | 0.05416 |
| Minimum | 0.030313 |
|
|
- Mean = 0.067328
- Std.dev = 0.0121502
- 22 items above graph maximum of 0.107508
|


