Data
290,912 items of data are available, covering 275,202 participants.
Defined-instances run from 0 to 1, labelled using Instancing
2.
Units of measurement are mmol/l.
| Maximum | 0.24051 |
| Decile 9 | 0.074262 |
| Decile 8 | 0.063216 |
| Decile 7 | 0.056727 |
| Decile 6 | 0.0519165 |
| Median | 0.047886 |
| Decile 4 | 0.044251 |
| Decile 3 | 0.040691 |
| Decile 2 | 0.036811 |
| Decile 1 | 0.031898 |
| Minimum | 0 |
|
|
- Mean = 0.0511232
- Std.dev = 0.0182387
- 2078 items above graph maximum of 0.116626
|
2 Instances
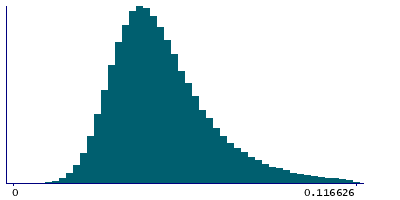
Instance 0 : Initial assessment visit (2006-2010) at which participants were recruited and consent given
274,210 participants, 274,210 items
| Maximum | 0.24051 |
| Decile 9 | 0.074345 |
| Decile 8 | 0.06331 |
| Decile 7 | 0.056805 |
| Decile 6 | 0.051995 |
| Median | 0.04796 |
| Decile 4 | 0.044307 |
| Decile 3 | 0.040733 |
| Decile 2 | 0.036849 |
| Decile 1 | 0.031924 |
| Minimum | 0 |
|

|
- Mean = 0.0511789
- Std.dev = 0.0182399
- 1929 items above graph maximum of 0.116766
|
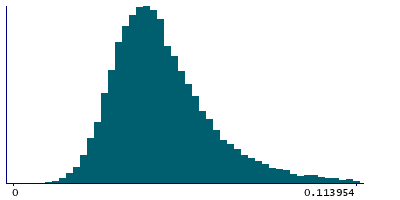
Instance 1 : First repeat assessment visit (2012-13)
16,702 participants, 16,702 items
| Maximum | 0.22583 |
| Decile 9 | 0.0727335 |
| Decile 8 | 0.061627 |
| Decile 7 | 0.0553375 |
| Decile 6 | 0.0505915 |
| Median | 0.046929 |
| Decile 4 | 0.043401 |
| Decile 3 | 0.039962 |
| Decile 2 | 0.0361695 |
| Decile 1 | 0.0315135 |
| Minimum | 0.00024308 |
|
|
- Mean = 0.0502091
- Std.dev = 0.0181935
- 160 items above graph maximum of 0.113954
|


