Data
285,561 items of data are available, covering 270,385 participants.
Defined-instances run from 0 to 1, labelled using Instancing
2.
Units of measurement are mmol/l.
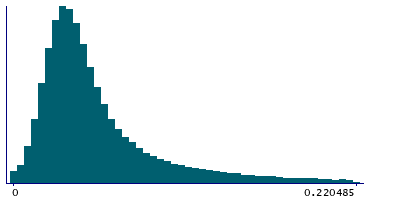
| Maximum | 3.8434 |
| Decile 9 | 0.119985 |
| Decile 8 | 0.078759 |
| Decile 7 | 0.06044 |
| Decile 6 | 0.0501325 |
| Median | 0.0429255 |
| Decile 4 | 0.037117 |
| Decile 3 | 0.031795 |
| Decile 2 | 0.026303 |
| Decile 1 | 0.0194855 |
| Minimum | 0 |
|
|
- Mean = 0.0605166
- Std.dev = 0.062075
- 7251 items above graph maximum of 0.220485
|
2 Instances
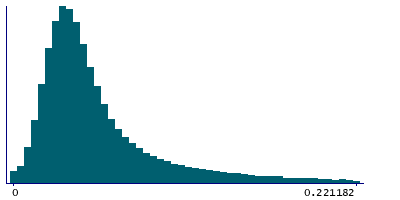
Instance 0 : Initial assessment visit (2006-2010) at which participants were recruited and consent given
269,174 participants, 269,174 items
| Maximum | 3.8434 |
| Decile 9 | 0.12043 |
| Decile 8 | 0.0790695 |
| Decile 7 | 0.06067 |
| Decile 6 | 0.0503355 |
| Median | 0.043116 |
| Decile 4 | 0.0373 |
| Decile 3 | 0.031973 |
| Decile 2 | 0.026478 |
| Decile 1 | 0.019678 |
| Minimum | 0 |
|
|
- Mean = 0.0607634
- Std.dev = 0.062246
- 6809 items above graph maximum of 0.221182
|
Instance 1 : First repeat assessment visit (2012-13)
16,387 participants, 16,387 items
| Maximum | 1.12 |
| Decile 9 | 0.112705 |
| Decile 8 | 0.0740775 |
| Decile 7 | 0.0566335 |
| Decile 6 | 0.0466555 |
| Median | 0.039807 |
| Decile 4 | 0.0339815 |
| Decile 3 | 0.028854 |
| Decile 2 | 0.0235125 |
| Decile 1 | 0.0167785 |
| Minimum | 0 |
|

|
- Mean = 0.0564639
- Std.dev = 0.0590492
- 430 items above graph maximum of 0.208631
|


