Data
290,955 items of data are available, covering 275,243 participants.
Defined-instances run from 0 to 1, labelled using Instancing
2.
Units of measurement are mmol/l.
| Maximum | 1.8847 |
| Decile 9 | 0.96825 |
| Decile 8 | 0.90698 |
| Decile 7 | 0.86638 |
| Decile 6 | 0.8331 |
| Median | 0.80304 |
| Decile 4 | 0.77428 |
| Decile 3 | 0.74453 |
| Decile 2 | 0.71139 |
| Decile 1 | 0.667765 |
| Minimum | 0.27476 |
|
|
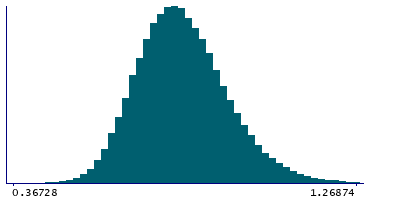
- Mean = 0.812294
- Std.dev = 0.120308
- 8 items below graph minimum of 0.36728
- 520 items above graph maximum of 1.26874
|
2 Instances
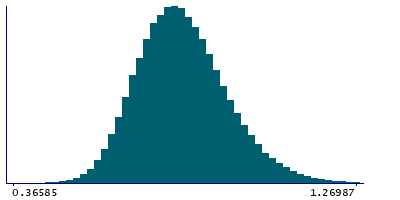
Instance 0 : Initial assessment visit (2006-2010) at which participants were recruited and consent given
274,252 participants, 274,252 items
| Maximum | 1.8847 |
| Decile 9 | 0.96853 |
| Decile 8 | 0.90708 |
| Decile 7 | 0.86628 |
| Decile 6 | 0.83298 |
| Median | 0.80295 |
| Decile 4 | 0.77408 |
| Decile 3 | 0.74414 |
| Decile 2 | 0.71093 |
| Decile 1 | 0.66719 |
| Minimum | 0.27476 |
|
|
- Mean = 0.812101
- Std.dev = 0.120514
- 8 items below graph minimum of 0.36585
- 485 items above graph maximum of 1.26987
|
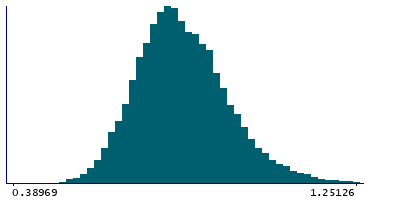
Instance 1 : First repeat assessment visit (2012-13)
16,703 participants, 16,703 items
| Maximum | 1.5589 |
| Decile 9 | 0.96407 |
| Decile 8 | 0.905605 |
| Decile 7 | 0.8677 |
| Decile 6 | 0.83515 |
| Median | 0.8046 |
| Decile 4 | 0.77722 |
| Decile 3 | 0.749835 |
| Decile 2 | 0.718605 |
| Decile 1 | 0.67688 |
| Minimum | 0.37902 |
|
|
- Mean = 0.81547
- Std.dev = 0.11683
- 1 item below graph minimum of 0.38969
- 38 items above graph maximum of 1.25126
|


