Data
290,953 items of data are available, covering 275,241 participants.
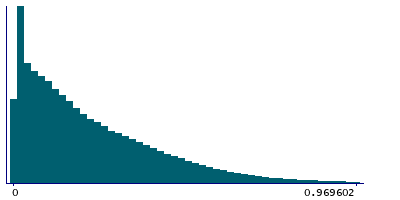
Defined-instances run from 0 to 1, labelled using Instancing
2.
Units of measurement are mmol/l.
| Maximum | 3.6941 |
| Decile 9 | 0.494915 |
| Decile 8 | 0.36907 |
| Decile 7 | 0.28543 |
| Decile 6 | 0.21939 |
| Median | 0.16613 |
| Decile 4 | 0.12211 |
| Decile 3 | 0.0841415 |
| Decile 2 | 0.049698 |
| Decile 1 | 0.0202285 |
| Minimum | 0.00011082 |
|
|
- Mean = 0.221936
- Std.dev = 0.203324
- 1861 items above graph maximum of 0.969602
|
2 Instances
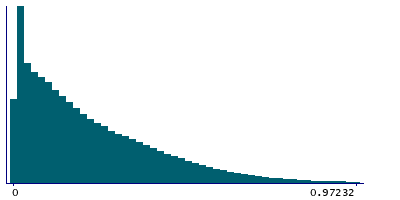
Instance 0 : Initial assessment visit (2006-2010) at which participants were recruited and consent given
274,250 participants, 274,250 items
| Maximum | 3.6941 |
| Decile 9 | 0.49622 |
| Decile 8 | 0.37041 |
| Decile 7 | 0.28649 |
| Decile 6 | 0.2201 |
| Median | 0.16657 |
| Decile 4 | 0.1223 |
| Decile 3 | 0.084125 |
| Decile 2 | 0.04954 |
| Decile 1 | 0.02012 |
| Minimum | 0.00011082 |
|
|
- Mean = 0.222535
- Std.dev = 0.20404
- 1759 items above graph maximum of 0.97232
|
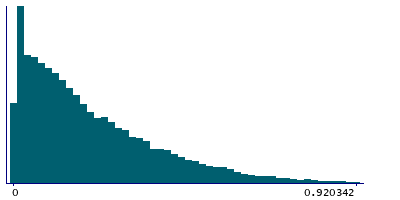
Instance 1 : First repeat assessment visit (2012-13)
16,703 participants, 16,703 items
| Maximum | 2.2133 |
| Decile 9 | 0.471225 |
| Decile 8 | 0.34832 |
| Decile 7 | 0.269055 |
| Decile 6 | 0.20809 |
| Median | 0.159475 |
| Decile 4 | 0.1197 |
| Decile 3 | 0.084492 |
| Decile 2 | 0.052141 |
| Decile 1 | 0.0221085 |
| Minimum | 0.00069564 |
|
|
- Mean = 0.212086
- Std.dev = 0.190901
- 111 items above graph maximum of 0.920342
|


