Data
290,953 items of data are available, covering 275,241 participants.
Defined-instances run from 0 to 1, labelled using Instancing
2.
Units of measurement are mmol/l.
| Maximum | 0.28411 |
| Decile 9 | 0.062582 |
| Decile 8 | 0.048805 |
| Decile 7 | 0.039432 |
| Decile 6 | 0.032051 |
| Median | 0.025771 |
| Decile 4 | 0.020223 |
| Decile 3 | 0.015078 |
| Decile 2 | 0.010066 |
| Decile 1 | 0.0044694 |
| Minimum | 3.3795e-07 |
|

|
- Mean = 0.0305919
- Std.dev = 0.023306
- 860 items above graph maximum of 0.120695
|
2 Instances
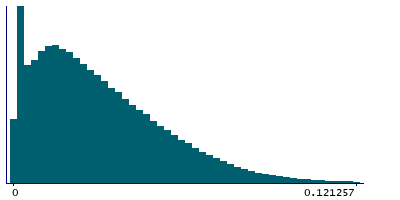
Instance 0 : Initial assessment visit (2006-2010) at which participants were recruited and consent given
274,250 participants, 274,250 items
| Maximum | 0.28411 |
| Decile 9 | 0.062871 |
| Decile 8 | 0.049041 |
| Decile 7 | 0.03963 |
| Decile 6 | 0.032205 |
| Median | 0.025893 |
| Decile 4 | 0.020299 |
| Decile 3 | 0.015141 |
| Decile 2 | 0.010101 |
| Decile 1 | 0.0044854 |
| Minimum | 3.3795e-07 |
|
|
- Mean = 0.030728
- Std.dev = 0.0234023
- 808 items above graph maximum of 0.121257
|
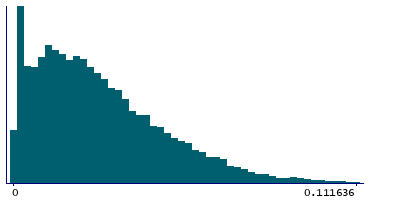
Instance 1 : First repeat assessment visit (2012-13)
16,703 participants, 16,703 items
| Maximum | 0.18335 |
| Decile 9 | 0.0579385 |
| Decile 8 | 0.0449785 |
| Decile 7 | 0.0361555 |
| Decile 6 | 0.0296005 |
| Median | 0.02402 |
| Decile 4 | 0.019067 |
| Decile 3 | 0.0141455 |
| Decile 2 | 0.0095262 |
| Decile 1 | 0.00424105 |
| Minimum | 0.00022481 |
|
|
- Mean = 0.0283577
- Std.dev = 0.021542
- 52 items above graph maximum of 0.111636
|


