Data
290,953 items of data are available, covering 275,241 participants.
Defined-instances run from 0 to 1, labelled using Instancing
2.
Units of measurement are mmol/l.
| Maximum | 0.27336 |
| Decile 9 | 0.0505575 |
| Decile 8 | 0.038918 |
| Decile 7 | 0.031044 |
| Decile 6 | 0.0249005 |
| Median | 0.01984 |
| Decile 4 | 0.0155695 |
| Decile 3 | 0.011715 |
| Decile 2 | 0.00800975 |
| Decile 1 | 0.003942 |
| Minimum | 8.4719e-05 |
|

|
- Mean = 0.0243883
- Std.dev = 0.0192273
- 1283 items above graph maximum of 0.097173
|
2 Instances
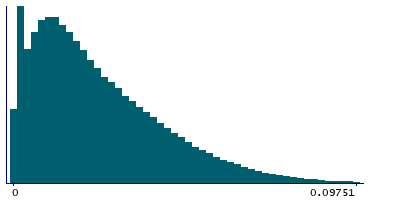
Instance 0 : Initial assessment visit (2006-2010) at which participants were recruited and consent given
274,250 participants, 274,250 items
| Maximum | 0.27336 |
| Decile 9 | 0.050714 |
| Decile 8 | 0.039054 |
| Decile 7 | 0.031165 |
| Decile 6 | 0.024979 |
| Median | 0.019892 |
| Decile 4 | 0.01559 |
| Decile 3 | 0.011712 |
| Decile 2 | 0.0079931 |
| Decile 1 | 0.003918 |
| Minimum | 8.4719e-05 |
|
|
- Mean = 0.0244527
- Std.dev = 0.0193046
- 1201 items above graph maximum of 0.09751
|
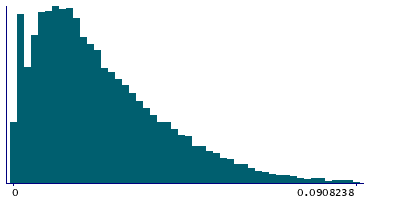
Instance 1 : First repeat assessment visit (2012-13)
16,703 participants, 16,703 items
| Maximum | 0.17721 |
| Decile 9 | 0.0476275 |
| Decile 8 | 0.0366335 |
| Decile 7 | 0.0292985 |
| Decile 6 | 0.023655 |
| Median | 0.019142 |
| Decile 4 | 0.0153085 |
| Decile 3 | 0.0117895 |
| Decile 2 | 0.0082689 |
| Decile 1 | 0.00443125 |
| Minimum | 0.0002455 |
|
|
- Mean = 0.0233319
- Std.dev = 0.0178775
- 77 items above graph maximum of 0.0908238
|


