Data
290,953 items of data are available, covering 275,241 participants.
Defined-instances run from 0 to 1, labelled using Instancing
2.
Units of measurement are mmol/l.
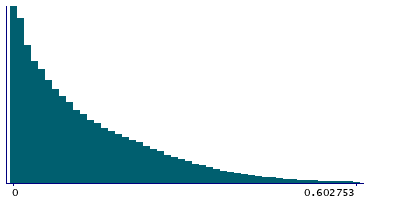
| Maximum | 2.6617 |
| Decile 9 | 0.305315 |
| Decile 8 | 0.223295 |
| Decile 7 | 0.16959 |
| Decile 6 | 0.12735 |
| Median | 0.0938485 |
| Decile 4 | 0.066464 |
| Decile 3 | 0.0435605 |
| Decile 2 | 0.02361 |
| Decile 1 | 0.00787715 |
| Minimum | 2.7156e-09 |
|
|
- Mean = 0.132139
- Std.dev = 0.131295
- 2344 items above graph maximum of 0.602753
|
2 Instances
Instance 0 : Initial assessment visit (2006-2010) at which participants were recruited and consent given
274,250 participants, 274,250 items
| Maximum | 2.6617 |
| Decile 9 | 0.30602 |
| Decile 8 | 0.2239 |
| Decile 7 | 0.17012 |
| Decile 6 | 0.12772 |
| Median | 0.094023 |
| Decile 4 | 0.066492 |
| Decile 3 | 0.043462 |
| Decile 2 | 0.023462 |
| Decile 1 | 0.007791 |
| Minimum | 2.7156e-09 |
|

|
- Mean = 0.132422
- Std.dev = 0.131709
- 2218 items above graph maximum of 0.604249
|
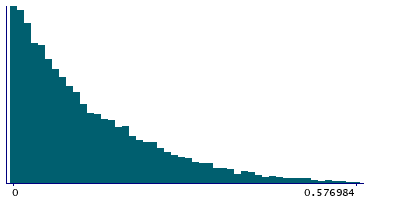
Instance 1 : First repeat assessment visit (2012-13)
16,703 participants, 16,703 items
| Maximum | 1.5568 |
| Decile 9 | 0.293185 |
| Decile 8 | 0.213025 |
| Decile 7 | 0.161475 |
| Decile 6 | 0.121705 |
| Median | 0.091305 |
| Decile 4 | 0.065933 |
| Decile 3 | 0.044873 |
| Decile 2 | 0.025685 |
| Decile 1 | 0.00938575 |
| Minimum | 9.584e-09 |
|
|
- Mean = 0.127486
- Std.dev = 0.124214
- 135 items above graph maximum of 0.576984
|


