Data
290,953 items of data are available, covering 275,241 participants.
Defined-instances run from 0 to 1, labelled using Instancing
2.
Units of measurement are mmol/l.
| Maximum | 1.7614 |
| Decile 9 | 0.38942 |
| Decile 8 | 0.31129 |
| Decile 7 | 0.25846 |
| Decile 6 | 0.21599 |
| Median | 0.17965 |
| Decile 4 | 0.14698 |
| Decile 3 | 0.11677 |
| Decile 2 | 0.087102 |
| Decile 1 | 0.0546645 |
| Minimum | 0.00089291 |
|

|
- Mean = 0.205534
- Std.dev = 0.136426
- 1001 items above graph maximum of 0.724175
|
2 Instances
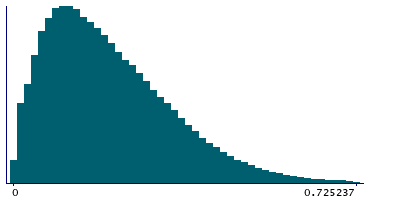
Instance 0 : Initial assessment visit (2006-2010) at which participants were recruited and consent given
274,250 participants, 274,250 items
| Maximum | 1.7614 |
| Decile 9 | 0.38989 |
| Decile 8 | 0.3119 |
| Decile 7 | 0.25886 |
| Decile 6 | 0.21629 |
| Median | 0.17989 |
| Decile 4 | 0.14708 |
| Decile 3 | 0.11679 |
| Decile 2 | 0.087023 |
| Decile 1 | 0.054557 |
| Minimum | 0.00089291 |
|
|
- Mean = 0.20578
- Std.dev = 0.136709
- 952 items above graph maximum of 0.725223
|
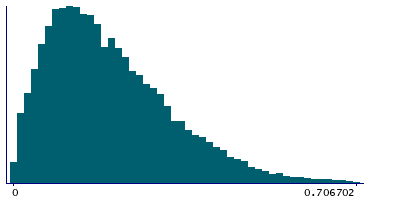
Instance 1 : First repeat assessment visit (2012-13)
16,703 participants, 16,703 items
| Maximum | 1.4292 |
| Decile 9 | 0.38165 |
| Decile 8 | 0.30206 |
| Decile 7 | 0.251675 |
| Decile 6 | 0.211175 |
| Median | 0.17556 |
| Decile 4 | 0.145445 |
| Decile 3 | 0.11658 |
| Decile 2 | 0.0880465 |
| Decile 1 | 0.056598 |
| Minimum | 0.0017763 |
|
|
- Mean = 0.201501
- Std.dev = 0.131626
- 51 items above graph maximum of 0.706702
|


