Data
290,953 items of data are available, covering 275,241 participants.
Defined-instances run from 0 to 1, labelled using Instancing
2.
Units of measurement are mmol/l.
| Maximum | 0.32022 |
| Decile 9 | 0.09259 |
| Decile 8 | 0.077452 |
| Decile 7 | 0.066778 |
| Decile 6 | 0.058119 |
| Median | 0.050365 |
| Decile 4 | 0.043168 |
| Decile 3 | 0.036003 |
| Decile 2 | 0.028521 |
| Decile 1 | 0.01971 |
| Minimum | 0.00030673 |
|

|
- Mean = 0.0539371
- Std.dev = 0.0288125
- 457 items above graph maximum of 0.16547
|
2 Instances
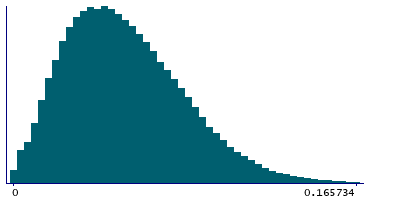
Instance 0 : Initial assessment visit (2006-2010) at which participants were recruited and consent given
274,250 participants, 274,250 items
| Maximum | 0.32022 |
| Decile 9 | 0.092722 |
| Decile 8 | 0.077616 |
| Decile 7 | 0.066932 |
| Decile 6 | 0.058231 |
| Median | 0.050456 |
| Decile 4 | 0.043225 |
| Decile 3 | 0.036036 |
| Decile 2 | 0.028547 |
| Decile 1 | 0.01971 |
| Minimum | 0.00030673 |
|
|
- Mean = 0.0540244
- Std.dev = 0.0288747
- 432 items above graph maximum of 0.165734
|
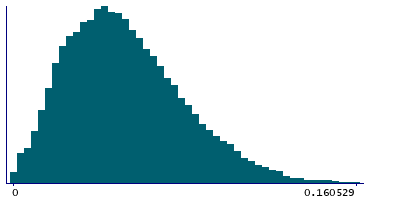
Instance 1 : First repeat assessment visit (2012-13)
16,703 participants, 16,703 items
| Maximum | 0.23279 |
| Decile 9 | 0.0901265 |
| Decile 8 | 0.074852 |
| Decile 7 | 0.064565 |
| Decile 6 | 0.056237 |
| Median | 0.0489725 |
| Decile 4 | 0.042328 |
| Decile 3 | 0.035494 |
| Decile 2 | 0.028049 |
| Decile 1 | 0.019724 |
| Minimum | 0.00065277 |
|
|
- Mean = 0.0525034
- Std.dev = 0.0277328
- 26 items above graph maximum of 0.160529
|


