Data
290,953 items of data are available, covering 275,241 participants.
Defined-instances run from 0 to 1, labelled using Instancing
2.
Units of measurement are mmol/l.
| Maximum | 0.17266 |
| Decile 9 | 0.0432725 |
| Decile 8 | 0.0352955 |
| Decile 7 | 0.029752 |
| Decile 6 | 0.025275 |
| Median | 0.021363 |
| Decile 4 | 0.017761 |
| Decile 3 | 0.014342 |
| Decile 2 | 0.010927 |
| Decile 1 | 0.00709785 |
| Minimum | 2.3349e-08 |
|
|
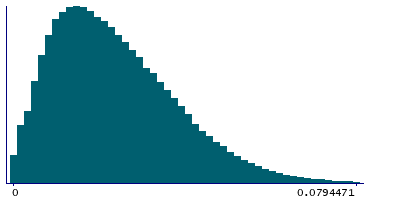
- Mean = 0.0236847
- Std.dev = 0.0145104
- 714 items above graph maximum of 0.0794471
|
2 Instances
Instance 0 : Initial assessment visit (2006-2010) at which participants were recruited and consent given
274,250 participants, 274,250 items
| Maximum | 0.17266 |
| Decile 9 | 0.043334 |
| Decile 8 | 0.035366 |
| Decile 7 | 0.029807 |
| Decile 6 | 0.025324 |
| Median | 0.021391 |
| Decile 4 | 0.017776 |
| Decile 3 | 0.014347 |
| Decile 2 | 0.010922 |
| Decile 1 | 0.007087 |
| Minimum | 2.3349e-08 |
|

|
- Mean = 0.0237168
- Std.dev = 0.0145445
- 673 items above graph maximum of 0.079581
|
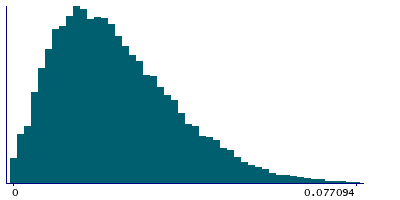
Instance 1 : First repeat assessment visit (2012-13)
16,703 participants, 16,703 items
| Maximum | 0.13697 |
| Decile 9 | 0.04218 |
| Decile 8 | 0.034186 |
| Decile 7 | 0.0287795 |
| Decile 6 | 0.024509 |
| Median | 0.020896 |
| Decile 4 | 0.017556 |
| Decile 3 | 0.014303 |
| Decile 2 | 0.0110185 |
| Decile 1 | 0.00726595 |
| Minimum | 8.5509e-06 |
|
|
- Mean = 0.0231573
- Std.dev = 0.0139272
- 36 items above graph maximum of 0.077094
|


