Data
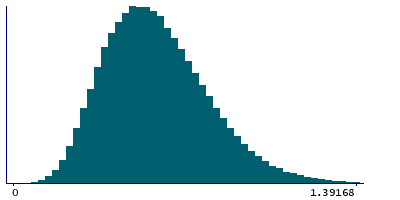
290,953 items of data are available, covering 275,241 participants.
Defined-instances run from 0 to 1, labelled using Instancing
2.
Units of measurement are mmol/l.
| Maximum | 2.4251 |
| Decile 9 | 0.86082 |
| Decile 8 | 0.750455 |
| Decile 7 | 0.67507 |
| Decile 6 | 0.61332 |
| Median | 0.5593 |
| Decile 4 | 0.507315 |
| Decile 3 | 0.455645 |
| Decile 2 | 0.39906 |
| Decile 1 | 0.329965 |
| Minimum | 0.022893 |
|
|
- Mean = 0.581242
- Std.dev = 0.210149
- 388 items above graph maximum of 1.39168
|
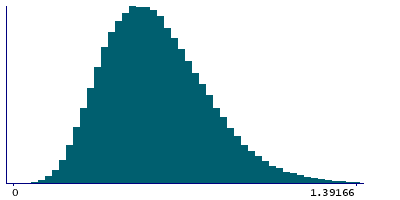
2 Instances
Instance 0 : Initial assessment visit (2006-2010) at which participants were recruited and consent given
274,250 participants, 274,250 items
| Maximum | 2.4251 |
| Decile 9 | 0.86079 |
| Decile 8 | 0.75085 |
| Decile 7 | 0.67542 |
| Decile 6 | 0.61338 |
| Median | 0.55935 |
| Decile 4 | 0.5073 |
| Decile 3 | 0.45553 |
| Decile 2 | 0.39903 |
| Decile 1 | 0.32992 |
| Minimum | 0.022893 |
|
|
- Mean = 0.581319
- Std.dev = 0.210279
- 366 items above graph maximum of 1.39166
|
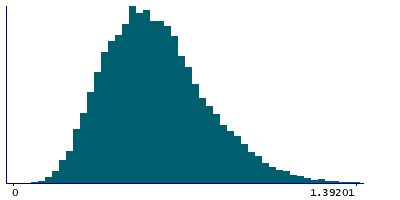
Instance 1 : First repeat assessment visit (2012-13)
16,703 participants, 16,703 items
| Maximum | 1.8931 |
| Decile 9 | 0.86161 |
| Decile 8 | 0.744565 |
| Decile 7 | 0.66892 |
| Decile 6 | 0.6123 |
| Median | 0.558875 |
| Decile 4 | 0.507485 |
| Decile 3 | 0.457335 |
| Decile 2 | 0.399935 |
| Decile 1 | 0.33121 |
| Minimum | 0.082197 |
|
|
- Mean = 0.579984
- Std.dev = 0.207996
- 22 items above graph maximum of 1.39201
|


