Data
290,953 items of data are available, covering 275,241 participants.
Defined-instances run from 0 to 1, labelled using Instancing
2.
Units of measurement are mmol/l.
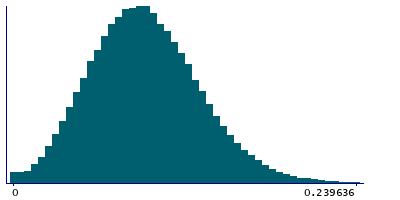
| Maximum | 0.37633 |
| Decile 9 | 0.14181 |
| Decile 8 | 0.12309 |
| Decile 7 | 0.11028 |
| Decile 6 | 0.099477 |
| Median | 0.0898135 |
| Decile 4 | 0.0801985 |
| Decile 3 | 0.070215 |
| Decile 2 | 0.058911 |
| Decile 1 | 0.0439835 |
| Minimum | 5.8749e-08 |
|
|
- Mean = 0.0918736
- Std.dev = 0.0385571
- 284 items above graph maximum of 0.239636
|
2 Instances
Instance 0 : Initial assessment visit (2006-2010) at which participants were recruited and consent given
274,250 participants, 274,250 items
| Maximum | 0.37633 |
| Decile 9 | 0.14176 |
| Decile 8 | 0.12307 |
| Decile 7 | 0.11027 |
| Decile 6 | 0.09948 |
| Median | 0.089831 |
| Decile 4 | 0.080253 |
| Decile 3 | 0.070296 |
| Decile 2 | 0.059038 |
| Decile 1 | 0.04413 |
| Minimum | 5.8749e-08 |
|

|
- Mean = 0.0919092
- Std.dev = 0.0385146
- 273 items above graph maximum of 0.23939
|
Instance 1 : First repeat assessment visit (2012-13)
16,703 participants, 16,703 items
| Maximum | 0.29309 |
| Decile 9 | 0.14279 |
| Decile 8 | 0.12348 |
| Decile 7 | 0.11053 |
| Decile 6 | 0.0994395 |
| Median | 0.089564 |
| Decile 4 | 0.0792495 |
| Decile 3 | 0.0690345 |
| Decile 2 | 0.056927 |
| Decile 1 | 0.0417565 |
| Minimum | 4.3874e-07 |
|

|
- Mean = 0.0912898
- Std.dev = 0.0392447
- 12 items above graph maximum of 0.243823
|


