Data
290,953 items of data are available, covering 275,241 participants.
Defined-instances run from 0 to 1, labelled using Instancing
2.
Units of measurement are mmol/l.
| Maximum | 0.42846 |
| Decile 9 | 0.13999 |
| Decile 8 | 0.12584 |
| Decile 7 | 0.11642 |
| Decile 6 | 0.1089 |
| Median | 0.10233 |
| Decile 4 | 0.096079 |
| Decile 3 | 0.089764 |
| Decile 2 | 0.082728 |
| Decile 1 | 0.0736845 |
| Minimum | 0.008033 |
|
|
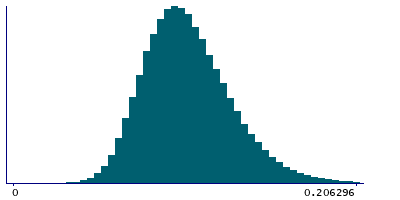
- Mean = 0.105144
- Std.dev = 0.0268
- 726 items above graph maximum of 0.206296
|
2 Instances
Instance 0 : Initial assessment visit (2006-2010) at which participants were recruited and consent given
274,250 participants, 274,250 items
| Maximum | 0.42846 |
| Decile 9 | 0.14003 |
| Decile 8 | 0.12585 |
| Decile 7 | 0.11641 |
| Decile 6 | 0.10888 |
| Median | 0.10231 |
| Decile 4 | 0.096057 |
| Decile 3 | 0.089752 |
| Decile 2 | 0.082724 |
| Decile 1 | 0.073674 |
| Minimum | 0.008033 |
|

|
- Mean = 0.10515
- Std.dev = 0.0268417
- 708 items above graph maximum of 0.206386
|
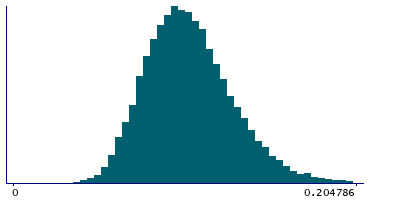
Instance 1 : First repeat assessment visit (2012-13)
16,703 participants, 16,703 items
| Maximum | 0.28366 |
| Decile 9 | 0.13933 |
| Decile 8 | 0.12568 |
| Decile 7 | 0.11657 |
| Decile 6 | 0.109235 |
| Median | 0.10277 |
| Decile 4 | 0.096408 |
| Decile 3 | 0.0899995 |
| Decile 2 | 0.0827675 |
| Decile 1 | 0.073874 |
| Minimum | 0.029942 |
|
|
- Mean = 0.105038
- Std.dev = 0.026107
- 18 items above graph maximum of 0.204786
|


