Data
290,953 items of data are available, covering 275,241 participants.
Defined-instances run from 0 to 1, labelled using Instancing
2.
Units of measurement are mmol/l.
| Maximum | 0.35875 |
| Decile 9 | 0.0981765 |
| Decile 8 | 0.0857705 |
| Decile 7 | 0.0780045 |
| Decile 6 | 0.072054 |
| Median | 0.066954 |
| Decile 4 | 0.0622125 |
| Decile 3 | 0.057482 |
| Decile 2 | 0.052394 |
| Decile 1 | 0.0458735 |
| Minimum | 0.005095 |
|

|
- Mean = 0.0701341
- Std.dev = 0.021881
- 1468 items above graph maximum of 0.150479
|
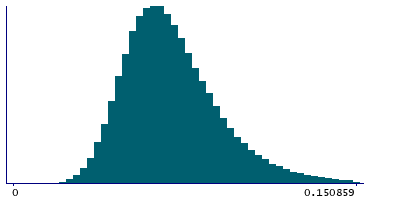
2 Instances
Instance 0 : Initial assessment visit (2006-2010) at which participants were recruited and consent given
274,250 participants, 274,250 items
| Maximum | 0.35875 |
| Decile 9 | 0.098319 |
| Decile 8 | 0.085839 |
| Decile 7 | 0.07803 |
| Decile 6 | 0.072042 |
| Median | 0.06691 |
| Decile 4 | 0.062142 |
| Decile 3 | 0.057399 |
| Decile 2 | 0.0523 |
| Decile 1 | 0.045779 |
| Minimum | 0.005095 |
|
|
- Mean = 0.0701307
- Std.dev = 0.0220008
- 1393 items above graph maximum of 0.150859
|
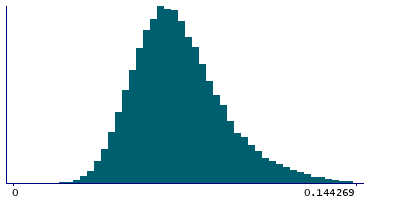
Instance 1 : First repeat assessment visit (2012-13)
16,703 participants, 16,703 items
| Maximum | 0.22822 |
| Decile 9 | 0.095937 |
| Decile 8 | 0.0847025 |
| Decile 7 | 0.0776455 |
| Decile 6 | 0.07225 |
| Median | 0.067668 |
| Decile 4 | 0.0632755 |
| Decile 3 | 0.0588885 |
| Decile 2 | 0.053955 |
| Decile 1 | 0.0476045 |
| Minimum | 0.02046 |
|
|
- Mean = 0.0701903
- Std.dev = 0.0198092
- 66 items above graph maximum of 0.144269
|


