Data
290,953 items of data are available, covering 275,241 participants.
Defined-instances run from 0 to 1, labelled using Instancing
2.
Units of measurement are mmol/l.
| Maximum | 1.9255 |
| Decile 9 | 0.824425 |
| Decile 8 | 0.74978 |
| Decile 7 | 0.69754 |
| Decile 6 | 0.65403 |
| Median | 0.61381 |
| Decile 4 | 0.57415 |
| Decile 3 | 0.53215 |
| Decile 2 | 0.48309 |
| Decile 1 | 0.416055 |
| Minimum | 0.036255 |
|

|
- Mean = 0.619063
- Std.dev = 0.160605
- 249 items above graph maximum of 1.23279
|
2 Instances
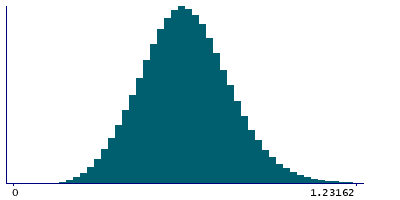
Instance 0 : Initial assessment visit (2006-2010) at which participants were recruited and consent given
274,250 participants, 274,250 items
| Maximum | 1.9255 |
| Decile 9 | 0.82435 |
| Decile 8 | 0.74981 |
| Decile 7 | 0.69754 |
| Decile 6 | 0.65403 |
| Median | 0.61393 |
| Decile 4 | 0.57444 |
| Decile 3 | 0.53259 |
| Decile 2 | 0.4837 |
| Decile 1 | 0.41708 |
| Minimum | 0.036255 |
|
|
- Mean = 0.619344
- Std.dev = 0.160296
- 237 items above graph maximum of 1.23162
|
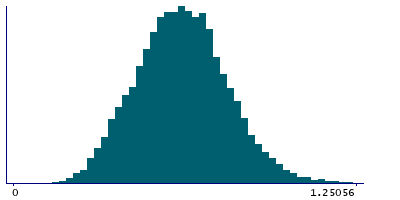
Instance 1 : First repeat assessment visit (2012-13)
16,703 participants, 16,703 items
| Maximum | 1.4147 |
| Decile 9 | 0.825625 |
| Decile 8 | 0.74935 |
| Decile 7 | 0.697605 |
| Decile 6 | 0.654005 |
| Median | 0.611405 |
| Decile 4 | 0.56841 |
| Decile 3 | 0.52488 |
| Decile 2 | 0.47347 |
| Decile 1 | 0.40069 |
| Minimum | 0.12064 |
|
|
- Mean = 0.614438
- Std.dev = 0.165536
- 13 items above graph maximum of 1.25056
|


