Data
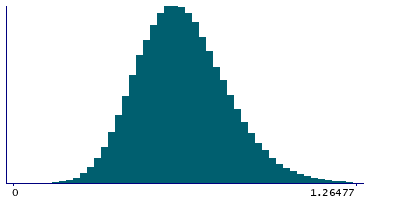
290,953 items of data are available, covering 275,241 participants.
Defined-instances run from 0 to 1, labelled using Instancing
2.
Units of measurement are mmol/l.
| Maximum | 1.9094 |
| Decile 9 | 0.842295 |
| Decile 8 | 0.75935 |
| Decile 7 | 0.702095 |
| Decile 6 | 0.65543 |
| Median | 0.61323 |
| Decile 4 | 0.5721 |
| Decile 3 | 0.530125 |
| Decile 2 | 0.481975 |
| Decile 1 | 0.41982 |
| Minimum | 0.029241 |
|
|
- Mean = 0.624251
- Std.dev = 0.167153
- 293 items above graph maximum of 1.26477
|
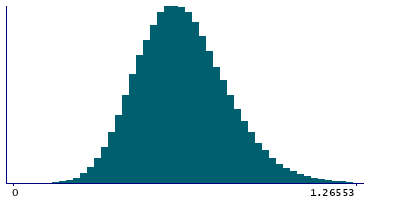
2 Instances
Instance 0 : Initial assessment visit (2006-2010) at which participants were recruited and consent given
274,250 participants, 274,250 items
| Maximum | 1.9094 |
| Decile 9 | 0.84281 |
| Decile 8 | 0.75974 |
| Decile 7 | 0.70245 |
| Decile 6 | 0.65578 |
| Median | 0.61358 |
| Decile 4 | 0.57239 |
| Decile 3 | 0.53041 |
| Decile 2 | 0.48234 |
| Decile 1 | 0.42009 |
| Minimum | 0.029241 |
|
|
- Mean = 0.624614
- Std.dev = 0.16723
- 276 items above graph maximum of 1.26553
|
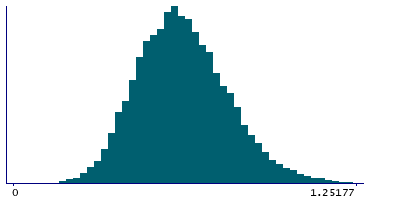
Instance 1 : First repeat assessment visit (2012-13)
16,703 participants, 16,703 items
| Maximum | 1.5487 |
| Decile 9 | 0.833475 |
| Decile 8 | 0.753455 |
| Decile 7 | 0.6964 |
| Decile 6 | 0.64895 |
| Median | 0.606795 |
| Decile 4 | 0.567645 |
| Decile 3 | 0.524015 |
| Decile 2 | 0.476625 |
| Decile 1 | 0.415175 |
| Minimum | 0.11032 |
|
|
- Mean = 0.618278
- Std.dev = 0.165771
- 17 items above graph maximum of 1.25177
|


