Data
290,953 items of data are available, covering 275,241 participants.
Defined-instances run from 0 to 1, labelled using Instancing
2.
Units of measurement are mmol/l.
| Maximum | 0.17756 |
| Decile 9 | 0.0469555 |
| Decile 8 | 0.040361 |
| Decile 7 | 0.036437 |
| Decile 6 | 0.033528 |
| Median | 0.031177 |
| Decile 4 | 0.029062 |
| Decile 3 | 0.027042 |
| Decile 2 | 0.024942 |
| Decile 1 | 0.022336 |
| Minimum | 0.00062251 |
|

|
- Mean = 0.0332676
- Std.dev = 0.0105114
- 1850 items above graph maximum of 0.071575
|
2 Instances
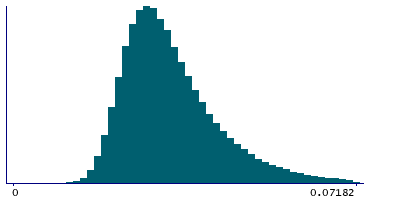
Instance 0 : Initial assessment visit (2006-2010) at which participants were recruited and consent given
274,250 participants, 274,250 items
| Maximum | 0.17756 |
| Decile 9 | 0.047061 |
| Decile 8 | 0.040429 |
| Decile 7 | 0.03647 |
| Decile 6 | 0.033539 |
| Median | 0.031166 |
| Decile 4 | 0.029039 |
| Decile 3 | 0.027008 |
| Decile 2 | 0.024903 |
| Decile 1 | 0.022302 |
| Minimum | 0.00062251 |
|
|
- Mean = 0.0332856
- Std.dev = 0.0105772
- 1752 items above graph maximum of 0.07182
|
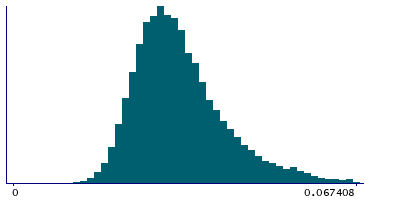
Instance 1 : First repeat assessment visit (2012-13)
16,703 participants, 16,703 items
| Maximum | 0.1045 |
| Decile 9 | 0.045194 |
| Decile 8 | 0.03937 |
| Decile 7 | 0.0359025 |
| Decile 6 | 0.0333865 |
| Median | 0.0313465 |
| Decile 4 | 0.0293835 |
| Decile 3 | 0.0275225 |
| Decile 2 | 0.025526 |
| Decile 1 | 0.02298 |
| Minimum | 0.010119 |
|
|
- Mean = 0.0329715
- Std.dev = 0.00935942
- 96 items above graph maximum of 0.067408
|


