Data
290,953 items of data are available, covering 275,241 participants.
Defined-instances run from 0 to 1, labelled using Instancing
2.
Units of measurement are mmol/l.
| Maximum | 3.4418 |
| Decile 9 | 1.1077 |
| Decile 8 | 0.904695 |
| Decile 7 | 0.769985 |
| Decile 6 | 0.66595 |
| Median | 0.58128 |
| Decile 4 | 0.50786 |
| Decile 3 | 0.442575 |
| Decile 2 | 0.378005 |
| Decile 1 | 0.30492 |
| Minimum | 0.011645 |
|
|
- Mean = 0.653159
- Std.dev = 0.325931
- 729 items above graph maximum of 1.91048
|
2 Instances
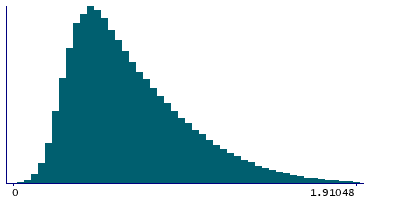
Instance 0 : Initial assessment visit (2006-2010) at which participants were recruited and consent given
274,250 participants, 274,250 items
| Maximum | 3.4418 |
| Decile 9 | 1.1019 |
| Decile 8 | 0.89967 |
| Decile 7 | 0.76585 |
| Decile 6 | 0.66217 |
| Median | 0.57798 |
| Decile 4 | 0.5052 |
| Decile 3 | 0.44053 |
| Decile 2 | 0.37624 |
| Decile 1 | 0.30375 |
| Minimum | 0.011645 |
|

|
- Mean = 0.649867
- Std.dev = 0.324443
- 699 items above graph maximum of 1.90005
|
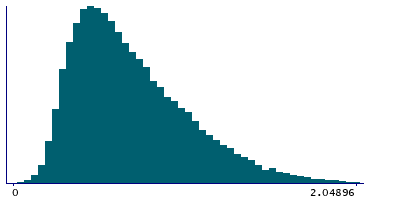
Instance 1 : First repeat assessment visit (2012-13)
16,703 participants, 16,703 items
| Maximum | 2.8402 |
| Decile 9 | 1.1892 |
| Decile 8 | 0.983225 |
| Decile 7 | 0.839545 |
| Decile 6 | 0.72997 |
| Median | 0.636 |
| Decile 4 | 0.55636 |
| Decile 3 | 0.481625 |
| Decile 2 | 0.41002 |
| Decile 1 | 0.32944 |
| Minimum | 0.035608 |
|
|
- Mean = 0.707204
- Std.dev = 0.345003
- 32 items above graph maximum of 2.04896
|


