Data
290,953 items of data are available, covering 275,241 participants.
Defined-instances run from 0 to 1, labelled using Instancing
2.
Units of measurement are mmol/l.
| Maximum | 1.7316 |
| Decile 9 | 0.534815 |
| Decile 8 | 0.427765 |
| Decile 7 | 0.3569 |
| Decile 6 | 0.30245 |
| Median | 0.25806 |
| Decile 4 | 0.22024 |
| Decile 3 | 0.18683 |
| Decile 2 | 0.15438 |
| Decile 1 | 0.11804 |
| Minimum | 1.4053e-08 |
|

|
- Mean = 0.296985
- Std.dev = 0.169311
- 707 items above graph maximum of 0.95159
|
2 Instances
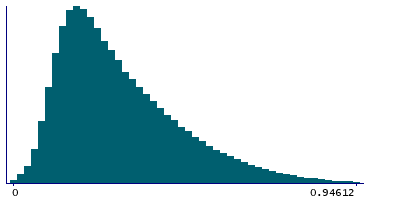
Instance 0 : Initial assessment visit (2006-2010) at which participants were recruited and consent given
274,250 participants, 274,250 items
| Maximum | 1.7316 |
| Decile 9 | 0.53178 |
| Decile 8 | 0.42494 |
| Decile 7 | 0.35462 |
| Decile 6 | 0.3004 |
| Median | 0.25628 |
| Decile 4 | 0.21876 |
| Decile 3 | 0.18573 |
| Decile 2 | 0.15362 |
| Decile 1 | 0.11744 |
| Minimum | 1.4053e-08 |
|
|
- Mean = 0.295238
- Std.dev = 0.16847
- 671 items above graph maximum of 0.94612
|
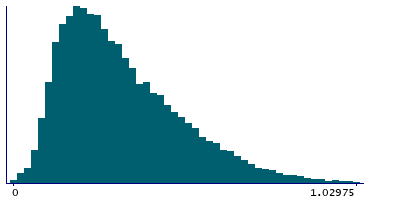
Instance 1 : First repeat assessment visit (2012-13)
16,703 participants, 16,703 items
| Maximum | 1.4159 |
| Decile 9 | 0.57921 |
| Decile 8 | 0.469235 |
| Decile 7 | 0.395785 |
| Decile 6 | 0.335715 |
| Median | 0.28705 |
| Decile 4 | 0.246285 |
| Decile 3 | 0.207535 |
| Decile 2 | 0.170275 |
| Decile 1 | 0.128665 |
| Minimum | 7.1831e-06 |
|
|
- Mean = 0.32566
- Std.dev = 0.180166
- 26 items above graph maximum of 1.02975
|


